Chart of Accounts: An Overview For SMBs (With Examples)
It’s probably fair to say that most small business owners aren’t finance experts, nor did they get into their field to stare at spreadsheets and financial reports all day.
However, having at least a reasonable understanding of how common statements work and the insights they offer is an important skill to master.
One such statement is the chart of accounts (COA), which is a cause of confusion for many SMB leaders.
A quick Google for “chart of accounts example” doesn’t help much, as every company’s chart of accounts looks a little different based on individual preferences as well as the limitations of the accounting platform that they’re using.
In this article, we’ll shed light on all things chart of accounts. We’ll define what a chart of accounts is, how it functions, what should be included, and why it’s important for finance leaders and business owners alike to regularly review their chart of accounts.
What Is A Chart of Accounts?
Your chart of accounts is an index of the different accounts on your ledger.
That is, it acts as a list of all of the different accounts (for instance, expenses accounts like wages, office expenses, and vehicle maintenance costs) that your financial records use.
Whenever you log a new income or expense entry in your finance software, you’ll need to make that entry into a specific account. The chart of accounts tells you which options you have to choose from.
It’s basically a representation of how you (or, in most cases, your accountant) organize your financials.
How Does A Chart of Accounts Work?
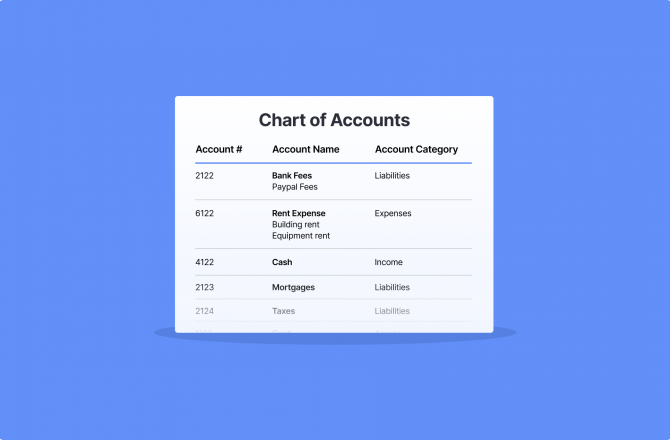
Your chart of accounts appears in list form and includes, at a minimum, each account name and number. Standard practice is also to include a basic description of the account for context, like this:

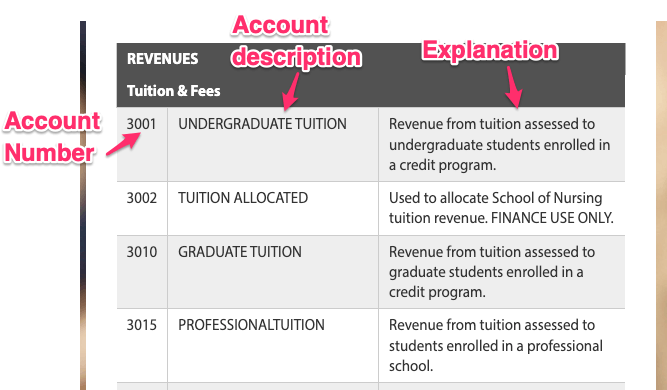
The chart of accounts appears in numerical order and is often divided into subcategories with headers included to help with navigating the list.
For instance, the typical chart of accounts displays revenues first, and expenses below, with category headers for each.
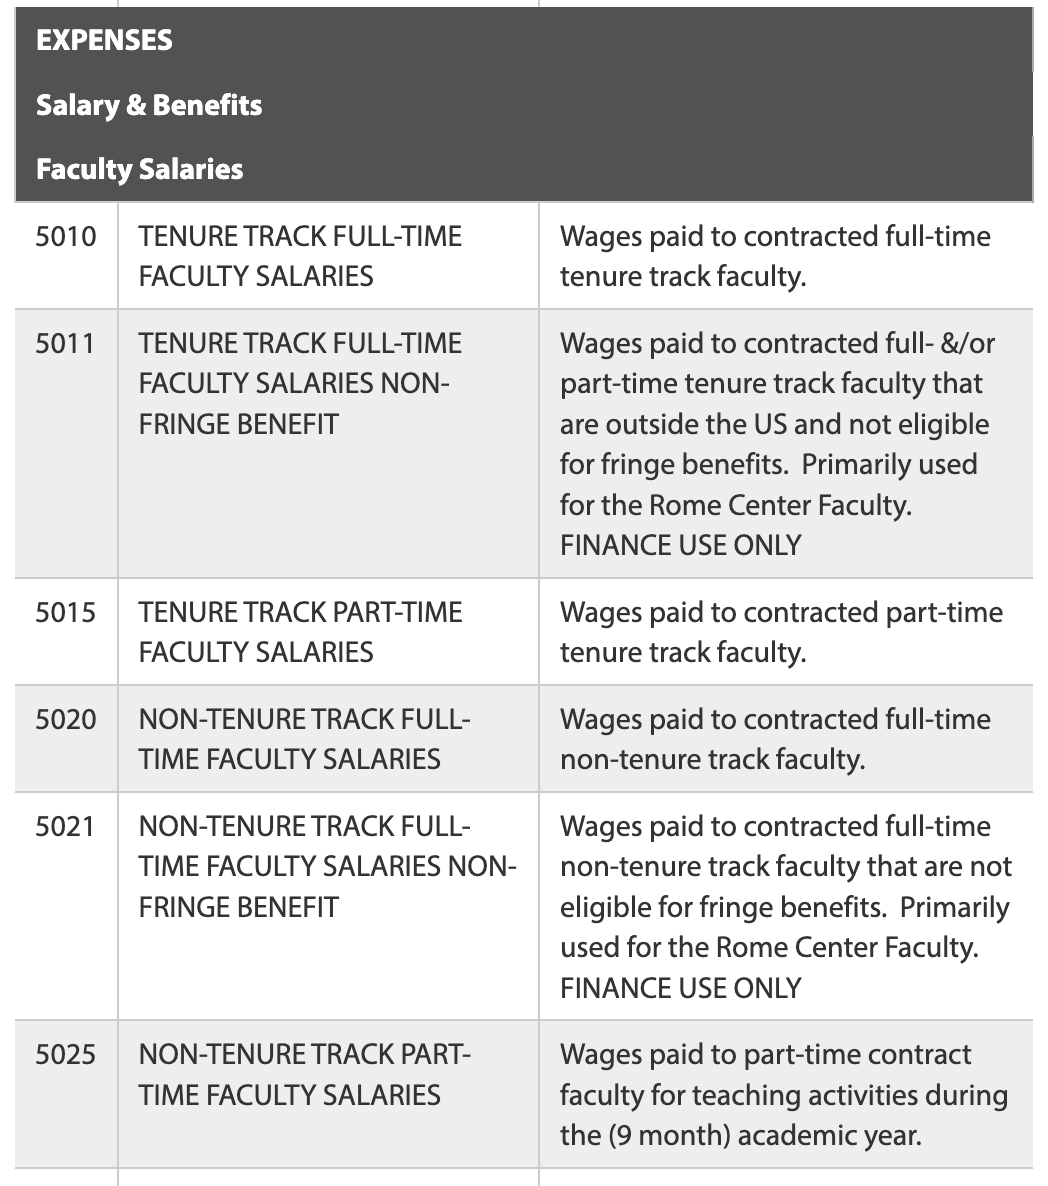
Then, you’ll see several expense accounts, often organized by category, like this:
Generally speaking, a chart of accounts shows financial accounts in the order that they appear in your financial statements, though this will depend on the account numbers you’ve chosen for each account.
Most chart of accounts lists are organized as such:
- Balance sheet accounts first
- Assets
- Liabilities
- Shareholders’ equity
- Income statement accounts second
- Revenue
- Expenses
Of course, every company’s chart of accounts looks slightly different, and this is primarily impacted by what you choose to include.
What Should Be Included In A Chart of Accounts?
There are many different ways you can format your chart of accounts, basically allowing you to pick and choose from different pieces that you can include.
At a minimum, your chart of accounts should include an account number and name for each account. However, it’s generally accepted as a best practice to include a brief explanation of the purpose of each account too.
Some other options you have when defining how your chart of accounts looks is to include account types, or other information, such as which financial statement they can be found on.
This chart of accounts example lets readers know whether an increase in the account is considered a debit or credit entry.
| No. | Account | To Increase | Description |
| 101 | Cash | Debit | The checking account balance and money received from customers but not yet deposited. |
| 120 | Accounts Receivable | Debit | Any accounts owed to the company for services performed or products sold but not yet paid for. |
| 130 | Merchandise Inventory | Debit | The cost of goods purchased but not yet sold. |
| 140 | Supplies | Debit | The cost of supplies that have not yet been used. |
| 150 | Prepaid Insurance | Debit | Cost of insurance premiums paid in advance. |
| 170 | Equipment | Debit | Cost to buy equipment. |
| 180 | Accumulated Depreciation – Equipment | Credit | The total amount of depreciation that has been allocated to an asset over its useful life |
This one forgoes that information but signals which financial report the account is likely to be featured in.
| Numeric Range | Account Type | Financial Report |
| 100 – 199 | Assets | Balance Sheet |
| 200 – 299 | Liabilities | Balance Sheet |
| 300 – 399 | Equity | Balance Sheet |
| 400 – 499 | Revenue | Profit & Loss |
| 500 – 599 | Cost of Goods Sold | Profit & Loss |
| 600 – 699 | Operating Expenses | Profit & Loss |
| 700 – 799 | Taxes Paid | Profit & Loss |
| 800 – 899 | Other Expenses | Profit & Loss |
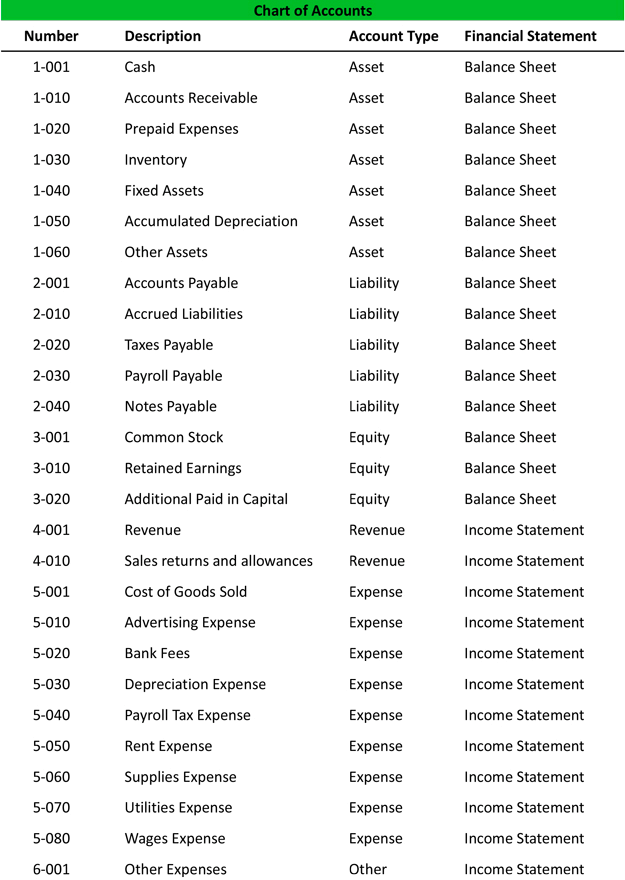
This chart of accounts example is different again, and shows which financial statement each account can be found in as well as the account type (whether it is an asset, liability, equity account, etc.)
In many cases, you won’t actually have a say in how your chart of accounts is formatted, as you’ll be working with a specific accounting platform that already defines formatting.
For example, Quickbooks, a popular account and bookkeeping platform, formats its chart of accounts like this:
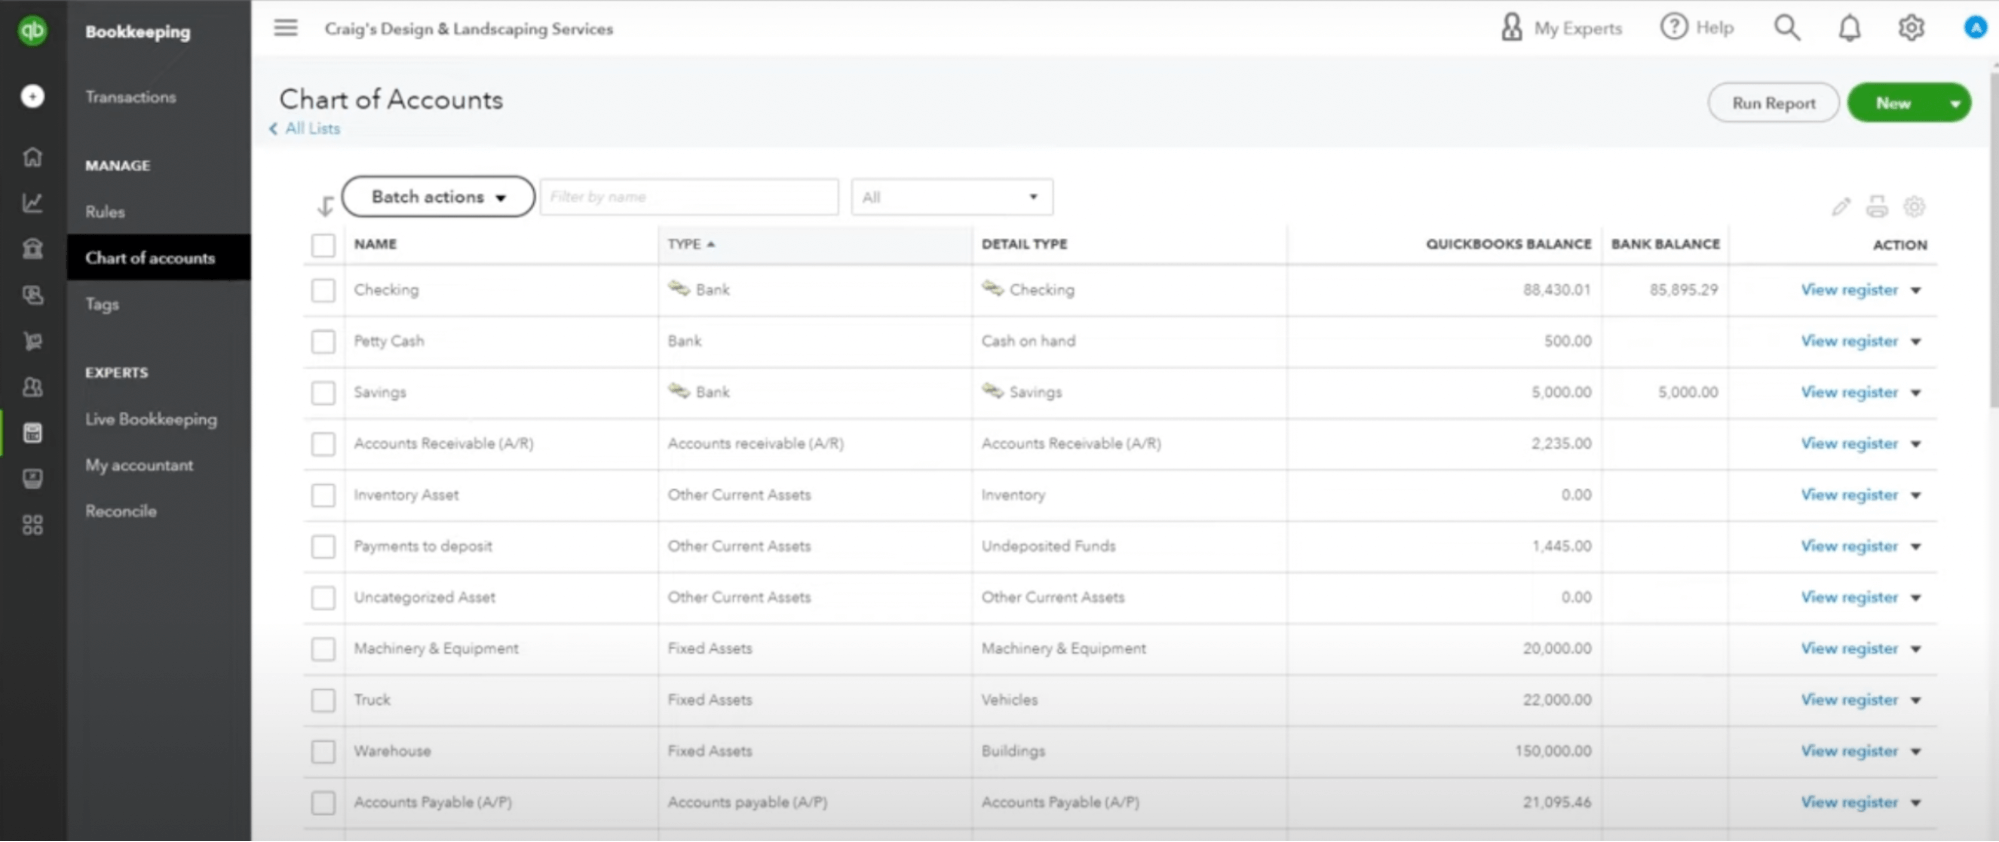
That’s perhaps one of the most detailed chart of accounts formats you’ll see, including the following information:
- The account name
- The account type
- The account details
- The account’s balance in Quickbooks
- The account’s balance in your bank (if applicable)
How to Use Your Chart of Accounts
At first glance, the chart of accounts may seem comparatively unuseful.
For example, the cashflow statement gives you an idea of how you expect cash to come in and out of your business in the coming financial year.
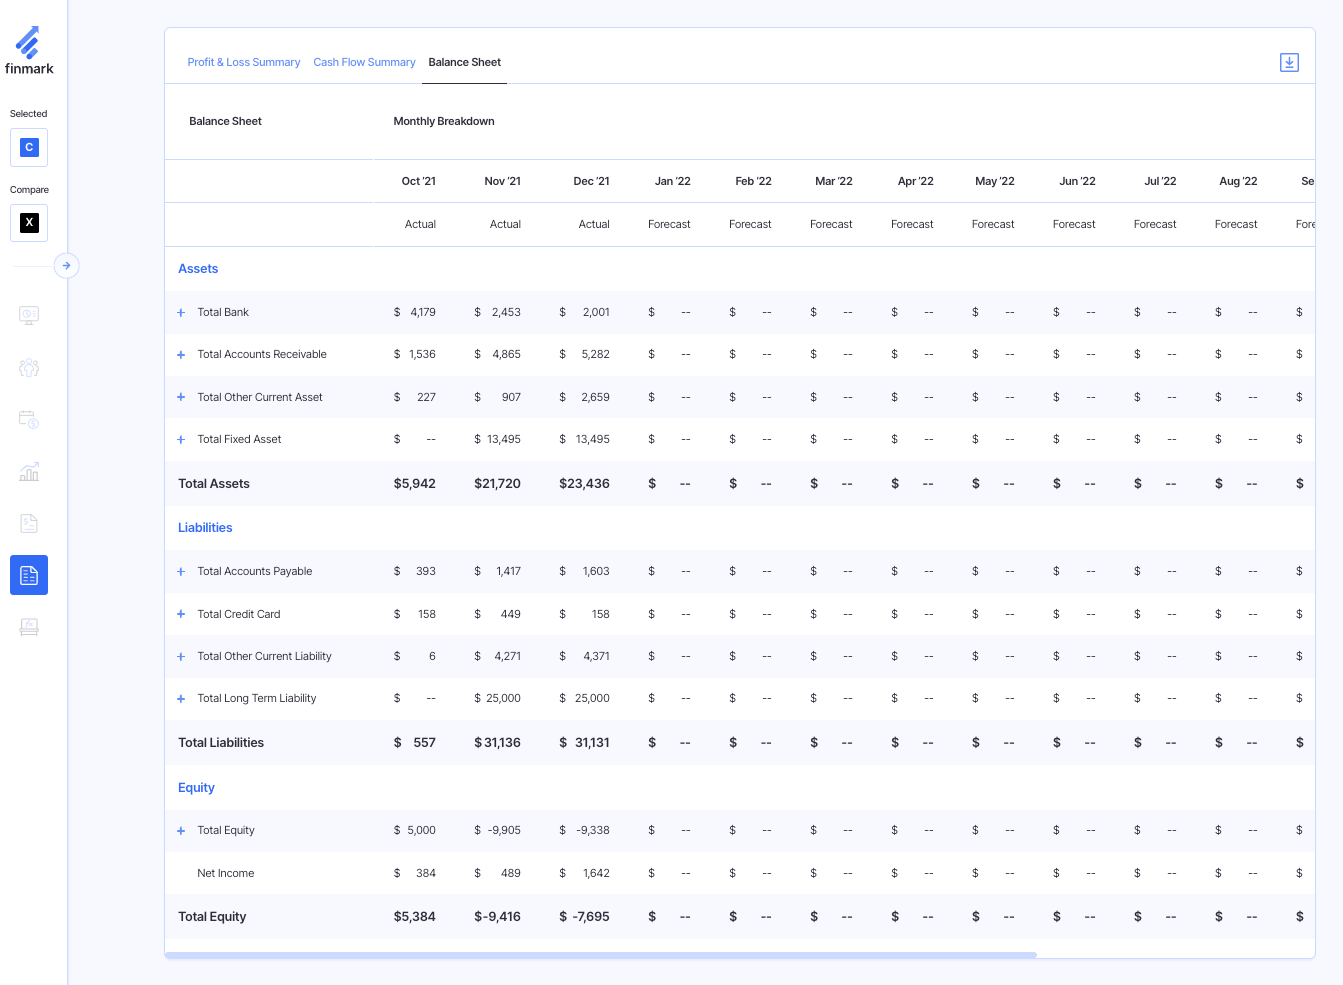
The balance sheet allows you to pore over a detailed analysis of your company’s assets and liabilities.
The chart of accounts, on the other hand, is really just a list of names and numbers.
While the chart of accounts is certainly more basic than other financial statements, it does offer some pretty important benefits.
Helps You Organize Your Finances
A good COA helps you understand how your finances are organized and allows you to keep records clean.
It’s a living document that can be updated as you add or remove accounts, allowing you to get as specific as you like by creating multiple subaccounts for a given account type.
Smaller organizations, on the other hand, may decide to hold fewer account subtypes to keep their chart of accounts concise and easy to interpret.
The point is, you’re able to organize your finances in a manner that suits your business specifically.
Allows You To Allocate Income and Expenses Properly
If you’re managing bookkeeping yourself, there may be instances you come across where it’s not entirely obvious which account you should ascribe a given entry.
Using your chart of accounts, you can easily eliminate options that don’t make sense until you come across the account that fits your entry most accurately.
Demonstrates Financial Information to Investors and Banks
A well-organized chart of accounts is a great tool for obtaining funding or loans.
It’s something that a sophisticated and experienced investor or lender can understand with ease, and gain a quick understanding of the financial health of your business by scanning through your chart of accounts.
Plus, having all of your data organized properly shows a good knowledge of financial health and best practices, which puts investors at ease that you’re confident and competent at managing money.
Chart of Accounts Examples
When you create your chart of accounts, you’ll choose numbers to assign to each account.
Most bookkeeping tools like Xero and Quickbooks have predefined ranges for specific account types, for example:
| Account number range | Account type |
| 100-199 | Assets |
| 200-299 | Liabilities |
| 300-399 | Owners’ Equity |
| 400-499 | Revenue |
| 500-599 | Cost of Goods Sold |
| 600-699 | Operating Expenses |
| 700-799 | Taxes Paid |
| 800-899 | Other Expenses |
From there, you’ll choose the specific account numbers you use for each account.
For instance, you’l choose numbers between 100 and 199 for all assets accounts (though most bookkeeping platforms will already have preloaded numbers for the most common account types).
Here are some examples of common account numbers that you can use in designing your own chart of accounts:
| Account Number | Account Name | Account Type |
| 101 | Cash | Assets |
| 102 | Accounts Receivable | Assets |
| 104 | Machinery and Equipment | Assets |
| 110 | Checking Account | Assets |
| 120 | Petty Cash | Assets |
| 201 | Accounts Payable | Liabilities |
| 203 | Loan Payable | Liabilities |
| 210 | Line of Credit | Liabilities |
| 220 | Taxes Payable | Liabilities |
| 301 | Owners’ Equity | Equity |
| 302 | Drawings | Equity |
| 310 | Contributed Capital | Equity |
| 320 | Retained Earnings | Equity |
| 401 | Fees Earned | Revenue |
| 410 | Service Revenue | Revenue |
| 420 | Product Sales | Revenue |
| 504 | Utilities | Expenses |
| 506 | Office Supplies | Expenses |
| 508 | Marketing | Expenses |
| 510 | Legal Costs | Expenses |
| 520 | Repairs & Maintenance | Expenses |
| 530 | Vehicle Expenses | Expenses |
| 540 | Subscriptions | Expenses |
| 602 | Insurance | Other Income |
| 605 | Stock Sales Gains | Other Income |
| 703 | Loss on Assets Sales | Other Expenses |
| 705 | Investment Expenses | Other Expenses |
Conclusion
Understanding how your chart of accounts works is a crucial skill for finance leaders and business owners alike to master.
Doing so helps you better organize your finances, allows to allocate financial entries more accurately, and gives you a detailed and up-to-date map of company financials to provide to investors when looking to obtain funding.
It’s not the only financial report you’ll need to master, however.
Learn more about the different financial statements you’ll want to be able to read and interpret in our guide: What is Financial Reporting? (3 Reports Every Business Needs).
Contributor
This content is presented “as is,” and is not intended to provide tax, legal or financial advice. Please consult your advisor with any questions.