Profit & Loss Projection: How to Forecast Your Income

The profit and loss (P&L) statement is a good indicator of how efficiently your company is growing. It goes beyond just looking at top-line revenue and provides insights into the cost of growth.
P&Ls are, by nature, however, a rearview mirror.
While understanding past performance is critical for measuring the impact of your strategic initiatives, you also need to be able to look to the future and forecast your profit and loss for the upcoming year.
Doing so can help you understand the long-term sustainability of your business and when (or if) you can become profitable.
Read on to find out how to stop looking in the rearview when it comes to your P&L statement, and how to use profit and loss projections to propel your business forward.
The Importance Of The Profit & Loss Statements And Projections
Profit and loss statements (also known as income statements) provide a detailed analysis of your company’s revenue experience for the previous year or another period of time.
They include information such as:
- Revenue (total + broken down by stream)
- Cost of goods sold
- Operating expenses by category
- Depreciation and amortization
- Taxes
- Gross and net profit
A P&L forecast presents the same information, but is an estimate for future revenue and expenses. This is based on your understanding of previous trends as well as expectations of the impact of strategic plans you have in place.
So, why create an income statement projection?
By making estimates as to how your company will perform, both in terms of revenue and expenses, you can make more informed decisions about company spending, investment, and budgets.
For example, you may build your P&L projection and realize that while you’re likely to increase revenue, you won’t hit profit goals due to increasing expenses in a particular area.
Then, you can use that information to make strategic changes that rectify that issue, allowing you to hit both your revenue and profit objectives.
Additionally, P&L projections can be used to compare different strategic growth options. For instance, you could create two projections that examine would revenue and expenses might look like in two expansion scenarios.
Then, what you find in your income statement projections can be used to guide your decision as to which expansion option will be most effective.
Interpreting P&L Projections
The data provided by your profit and loss projections are ripe for interpretations that fuel strategic recommendations that finance can provide to the C-Suite.
A few examples include:
- Revenue growth rate: Measures how quickly revenue is growing and describes your ability to acquire new customers and generate new revenue from existing ones
- Gross profit margin: Measures the difference between the selling and purchase price of the goods you’re selling as a percentage.
- EBITDA margin: Measures the operational profitability of your business by comparing EBITDA to revenues.
- Net debt/EBITDA: Measures your company’s ability to repay financial debts using EBITDA as a quick proxy for cash flow.
Effective finance teams use all of this data to inform the strategic direction of their company.
For example, you may compare your revenue growth rate with your EBITDA margin and note that while revenue is growing, your margin is actually decreasing due to unanticipated growth in an expense line item.
Then, you’re able to use that new finding to take action to mitigate that expense increasing any further (and potentially reduce it).
Also read: Projections vs. Forecasts: When & How to Use Each
5 Steps To Creating A P&L Projection
Ready to create your first profit and loss projection? Follow these five steps.
1. Begin With An Accurate P&L Statement
The first step in creating an accurate and insightful P&L statement is to begin with a reasonable baseline.
That essentially means that you need to have a current and up-to-date profit and loss statement. Hint: you can use Finmark from BILL to do this for you.
With this information in hand, you can begin looking at trends.
For instance, you may look at the monthly P&L statement for the last 12 months, and calculate monthly growth rates for each revenue stream.
Look out for long-term stable trends as well as recent short-term ones. The long-term trends are safer for projecting revenue, whereas recent short-term trends may disproportionately bump up your overall annual growth rate.
2. Extrapolate Based On Current Growth Rates
Now, use your understanding of income growth rates to extrapolate and begin building out your forecast.
Say, for example, that you’ve been growing revenue by 10% per month, and that trend is consistent across the last 18 months. It’s a fairly safe bet, then, that this will continue to be the case going forward, all else being the same.
So, you can go ahead and overlay this information into your profit and loss projection.
Remember, you’re only using historical trends to inform projections at this point. Forecast based on that information, and only then move forward to consider the impact of strategic growth initiatives you plan to execute in the upcoming financial period.
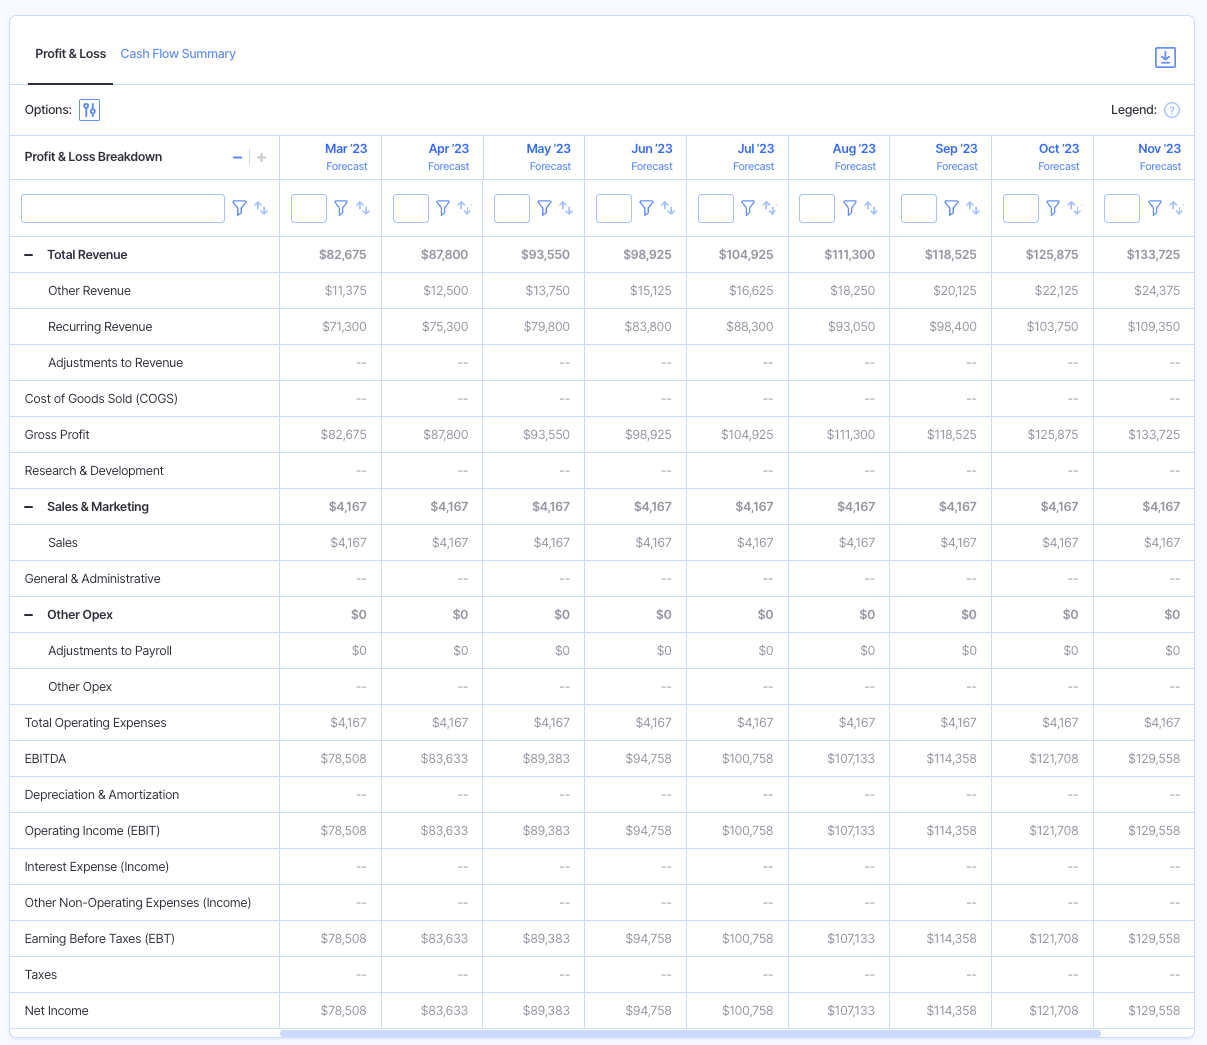
If you’re using Finmark (which you should), much of this process is handled automatically. Simply set your projected growth rate and other variables, and Finmark will calculate your projected in your P&L for you.
3. Integrate The Expected Impact Of Your Strategic Initiatives
Now you can start to look at the expected revenue impact of next year’s strategic growth initiatives,and add these expectations into your P&L projection.
Let’s say, for example, that you recently did an analysis of your revenue drivers and have come to understand that advertising on Instagram is a huge customer acquisition channel for you.
To date, you’ve also been running ads on TikTok and Twitter, but these aren’t the contributors to success you had expected them to be.
As such, you’ve decided to revert all social media ad spending to Instagram, as well as allocate an additional $50,000 in budget per quarter.
Based on your analysis of your previous success advertising on Instagram, you anticipate that this strategic shift will generate an additional $1.2m in revenue from new customers in the upcoming year.
Add those expectations to your income statement forecast now.
4. Calculate And Add Budgeted Expenses
P&L statements cover two halves of the financial coin: revenue and expenses.
So far, we’ve only looked at revenue.
At this stage, you’ll need to do some expense calculations and add that information to your forecast.
Again, start from a base of what you’re already doing, then consider any trends (for instance, decreasing production costs due to improvements in automation abilities).
Lastly, make sure you also account for the cost of any new strategic initiatives.
In our example above, your company planned to invest an additional $50,000 per quarter into Instagram ads. This will need to be added to your profit and loss projection as well.
Be careful to consider potential hidden costs. For instance, all of that additional investment in ads might require you to bring another freelance social media specialist into the mix, which adds another expense layer.
Tip: You can automate this process in Finmark. When you create new expenses (e.g. an increase in Facebook Ads spend), it’ll be reflected in your P&L projection. And you can use hiring triggers to automatically build new hires into your forecast based on on your criteria (e.g. add one new social media specialist per $X in Instagram Ads expenses.)
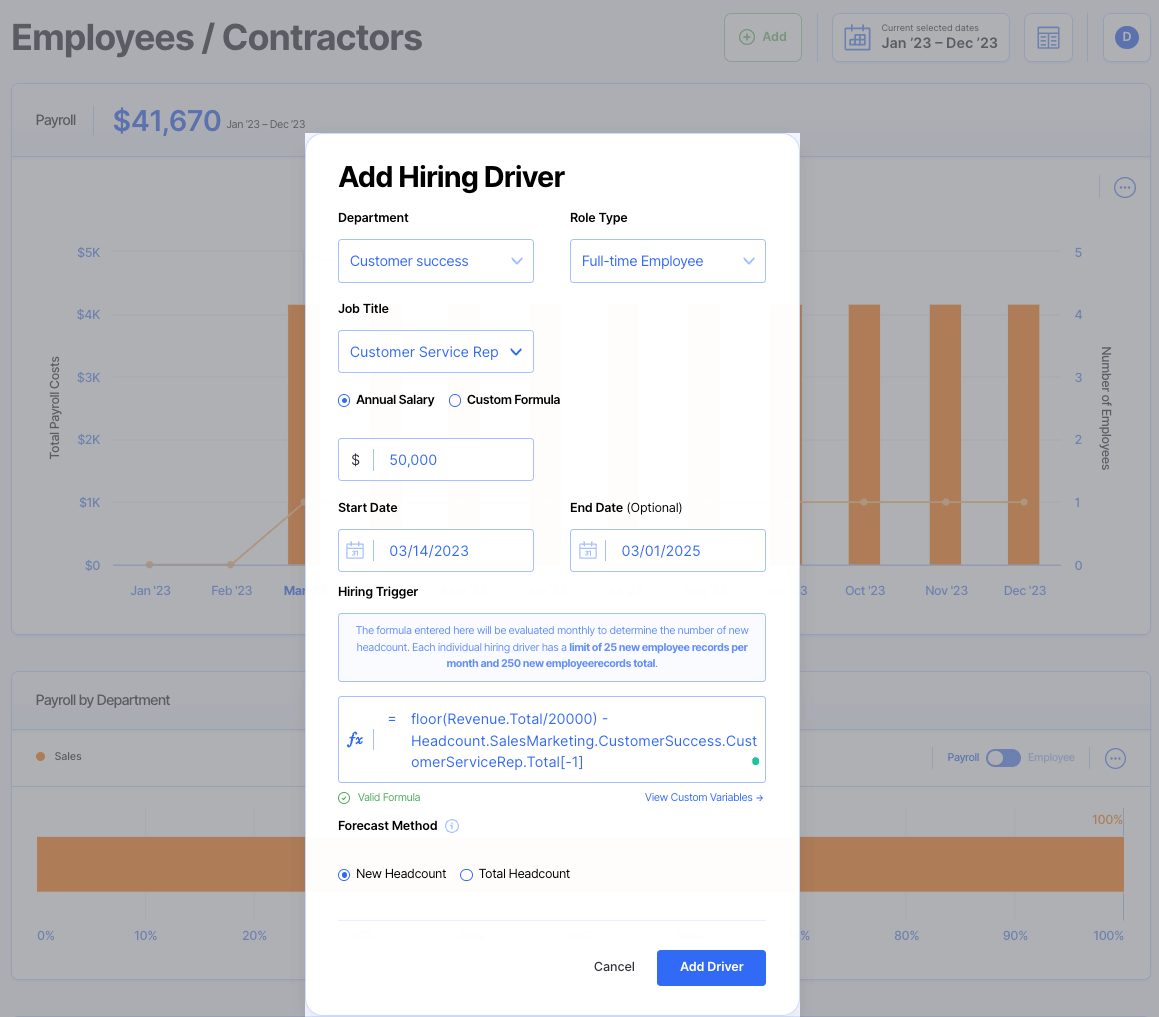
Example of a hiring driver that automatically adds a new customer service rep to our hiring plan based on revenue goals
5. Project Gross And Net Profit
The final step is to use all of this information to project your gross and net profit figures for the upcoming financial figures.
Gross profit is total revenue minus your cost of goods sold.
For example, if you’re a retail business importing products and selling them in a local store, then your COGS will be the cost of those items. If you’re a marketing agency, however, your cost of goods sold is more likely to be made up of contractor expenses.
Net profit is your gross profit less all of your other expenses, such as:
- Research and development costs
- Sales and marketing costs
- Interest and debt expenses
- Tax repayments
- Depreciation
- Amortization
- Administrative expenses such as office supplies
Create P&L Projections Instantly With Finmark
Project and loss statements and projections are critical financial reports that all teams should be creating and analyzing on a regular basis.
However, simply creating a projection isn’t the end.
Businesses should spend the bulk of their time analyzing the data and identifying the implications it has for their business—not creating reports
Unfortunately, too many finance teams get bogged down in the report creation part, spending hours pulling data from various sources to create accurate and comprehensive reports. This leaves them very little time for the analysis component.
We believe this needs to change, and we’ve got the perfect partner for ambitious finance teams looking to spend less time on report creation and more time on analysis: Finmark from BILL.
Finmark is the financial planning tool for future-focused businesses
With Finmark, you can connect all of your data sources (such as your accounting and payroll platforms), and create automated reports and forecasts, such as P&L projections.
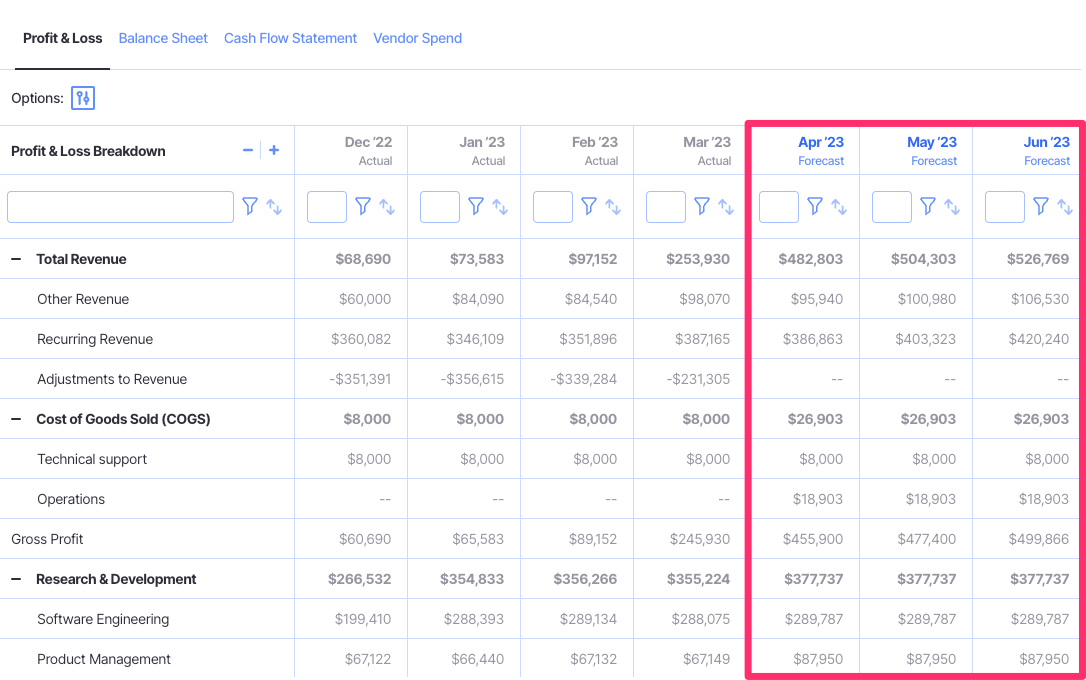
This means that, at any moment, you can simply open up your dashboard and analyze past and potential future financial performance.
Finmark automatically creates a P&L report for you, so you can spend more time analyzing the data than creating reports. Get started with your 30-day trial today!
Contributor
This content is presented “as is,” and is not intended to provide tax, legal or financial advice. Please consult your advisor with any questions.