Revenue Drivers: A Guide for Startups
After hours of staring at your computer screen and fidgeting with spreadsheets, you finally did it. You built your revenue model! In your model, you planned for 10% MoM growth in Q1.
But April comes around and you notice you only grew 5% MoM in Q1. Naturally, you start freaking out trying to figure out what happened.
If your model didn’t account for where your 10% revenue growth was supposed to come from, you’re going to have a bumpy road ahead of you. You don’t have a starting point of where to look, outside of your original assumption of 10% growth.
But if you included all of your revenue drivers into your model, you’ll have a much easier time pinpointing exactly what went wrong and what adjustments you need to make going forward.
That’s what this guide is all about—revenue drivers.
We’ll give you an overview of what revenue drivers are and why they’re so important for your business. Then we’ll show you how to build them into your financial model and give you some best practices to keep in mind along the way.
What Are Revenue Drivers?
When you’re forecasting revenue for your financial model, you need to make certain assumptions. Those assumptions should be based on data, whether it be past performance, industry benchmarks, or something else.
For instance, if you’ve historically grown revenue 5% MoM during the winter, and 10% MoM during the summer, it’s easier to forecast what your revenue will look like next winter and summer.
However, building a model based on just those broad assumptions doesn’t give you the flexibility to make adjustments and test things. You need to get more granular.
Knowing that you’ve historically grown 5% MoM during the winter and 10% during the summer months is nice.
But unless you know what led to the growth, why you grow more in the summer than winter, and how much it costs to generate the growth, it’s hard to plan for the future or make adjustments when your assumptions are off.
Revenue drivers are literally the things that “drive your revenue”.
They’re the inputs or variables your revenue model is based on. They’re the actions you took and investments you made to grow 5% during winter months and 10% during the summer.
So when you’re building your model, instead of saying:
“We expect to grow revenue 10% MoM during the summer”
You can say:
“We expect to grow revenue 10% MoM during the summer by doing xyz”
Next, let’s take a look at what those “xyz” actions and investments are.
Types of Revenue Drivers
Unless you’re just lucky (and luck isn’t a strategy), you’re going to need to spend money to drive revenue for your business at some point. Growth doesn’t happen auto-magically.
With revenue drivers, you can tie your actions and the money you’re spending to the revenue it’s generating. Using that data and insights, you can more accurately predict what your revenue will look like in the future.
Now, think about the variables or levers you can pull to drive your revenue. Most likely, they’ll fall under one of two categories:
- Marketing: You run marketing campaigns to generate new revenue for your business. Whether it’s social media ads, search marketing, partnerships, media buys, or any other channel, they’re all ways to drive revenue for your business.
- Sales: The other common revenue driver is sales. Each deal your sales team closes drives revenue.
By inputting your assumptions of how you think you’ll perform, you’ll be able to get an idea of what your revenue will look like 3, 6, or 12 months from now, and how much it’ll cost to get there.
You’ll be able to ask and answer questions like:
- What will revenue look like if I spend more on podcast ads?
- What impact will turning off social media ads have on revenue over the next few months?
- If I’m able to cut down my sales team ramp time, how much faster will revenue grow?
- What does my revenue look like if my SMB sales team makes 85% quota instead of 90%?
Being able to test and tweak all these assumptions allows you to create and adjust your strategy to grow more efficiently and spend money in the right areas.
Related: How to Build More Accurate Forecasts With Driver-Based Planning
Marketing-Led Revenue Drivers
As I mentioned earlier, adding revenue drivers into your model gives you more flexibility and control over your growth plans.
In a generic model (especially if you’re using an Excel template), you might broadly assume 10% MoM revenue growth. But when you build revenue drivers into your model, you get more granular into where that 10% growth will come from.
Will it be from Facebook Ads, Google Ads, podcast sponsorships, a push towards enterprise customers, or any other variables that will potentially drive your revenue.
We can’t stress this enough…
Let’s visualize what it looks like to build revenue drivers into your model. First, we’ll start with marketing-led drivers, then we’ll cover sales.
Fyi: I’m using Finmark to build these examples. You can try it out yourself with a free trial!
Marketing-led revenue drivers are the marketing related expenses that you can tie to revenue.
Some common examples include:
- Facebook Ads
- Google Ads
- Podcast sponsorships
- Display ads
Essentially, it’s any marketing activity that drive revenue.
Here’s an example.
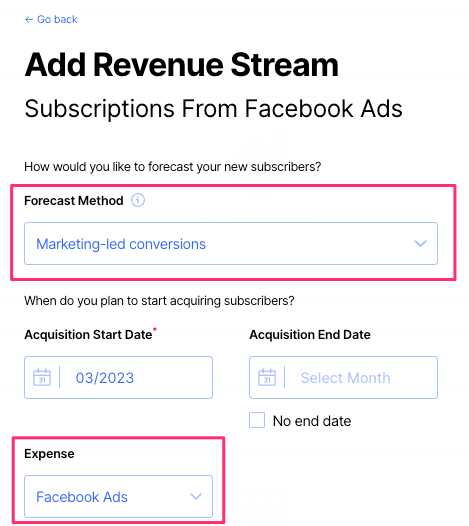
We’re an imaginary SaaS startup that offers three pricing plans—Basic, Premium, and Enterprise. We run marketing campaigns to get top of funnel leads that will eventually convert into paying customers.
We want to forecast what our revenue will look like if we run Facebook Ad campaigns for the next few months.
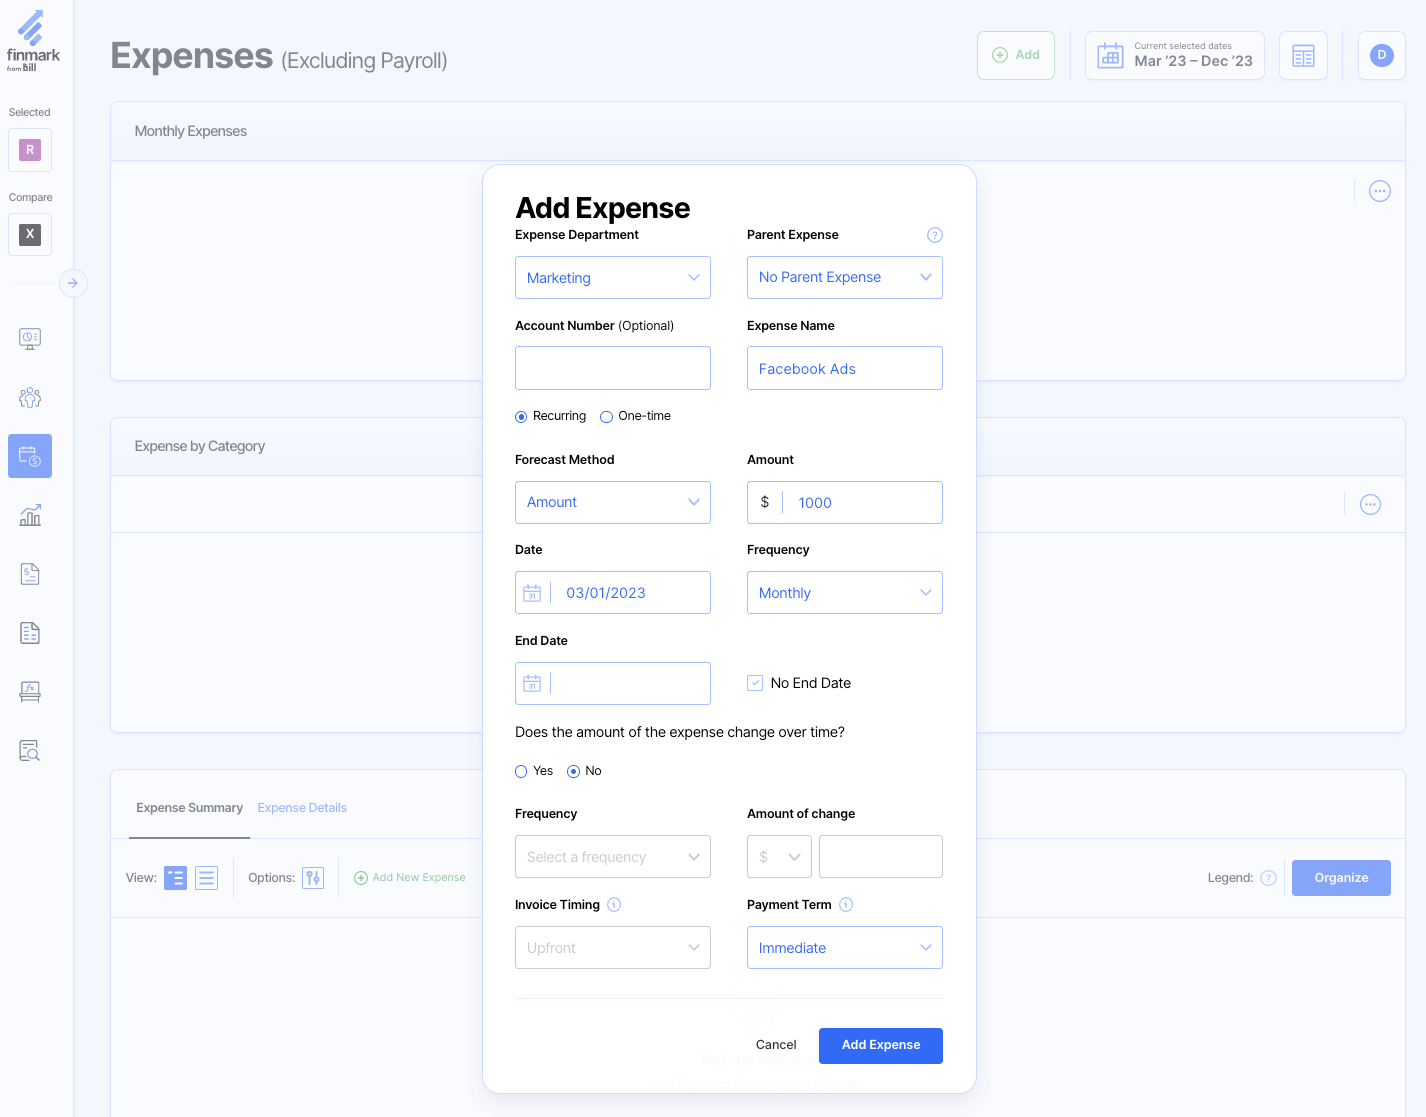
To get started, I’ll create a $1,000 monthly expense for Facebook Ads in Finmark.
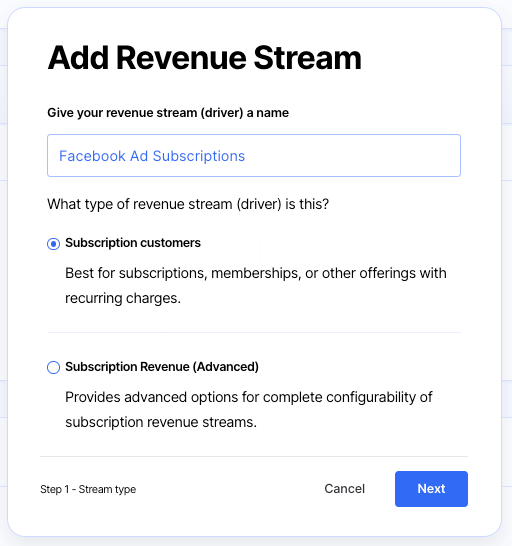
So I’ll add in a new revenue stream. A revenue stream is simply what your customers are paying for (what you’re selling). In this case, it’s our monthly subscriptions.
Now we’re going to get into the nitty-gritty of your revenue drivers by filling in a few assumptions. These assumptions are what will determine what our revenue growth projections look like.
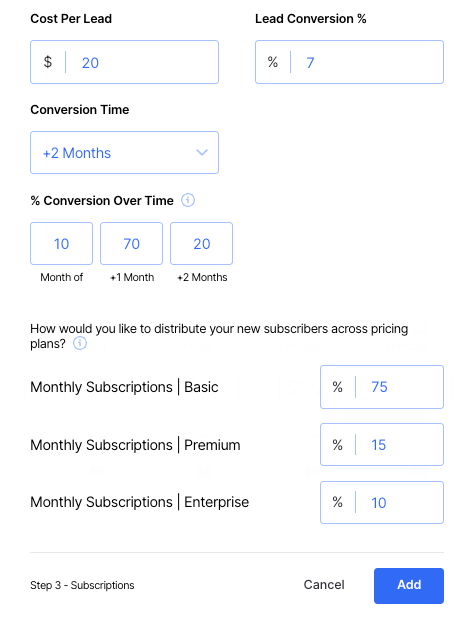
Here’s a detailed breakdown of each assumption and some tips for figuring them out with your own model.
Cost Per Lead (CPL)
Your cost per lead is the amount of money you spend to acquire a new lead. To calculate your CPL, divide your total expense for the marketing channel (i.e. Facebook Ads) by the number of leads you plan to acquire.
For example, if you spend $1,000 and get 50 leads, your CPL is $20.
Since CPL can vary based on your industry, price point, product, and a ton of other factors, it can be difficult to estimate what yours will be. The easiest solution is to base your estimates on past performance.
For instance, if you’ve historically had a CPL of $25, you can use that as your baseline.
However, in some cases, you might not have historical data. For instance, if you’re experimenting with a new marketing channel you’ve never tested before.
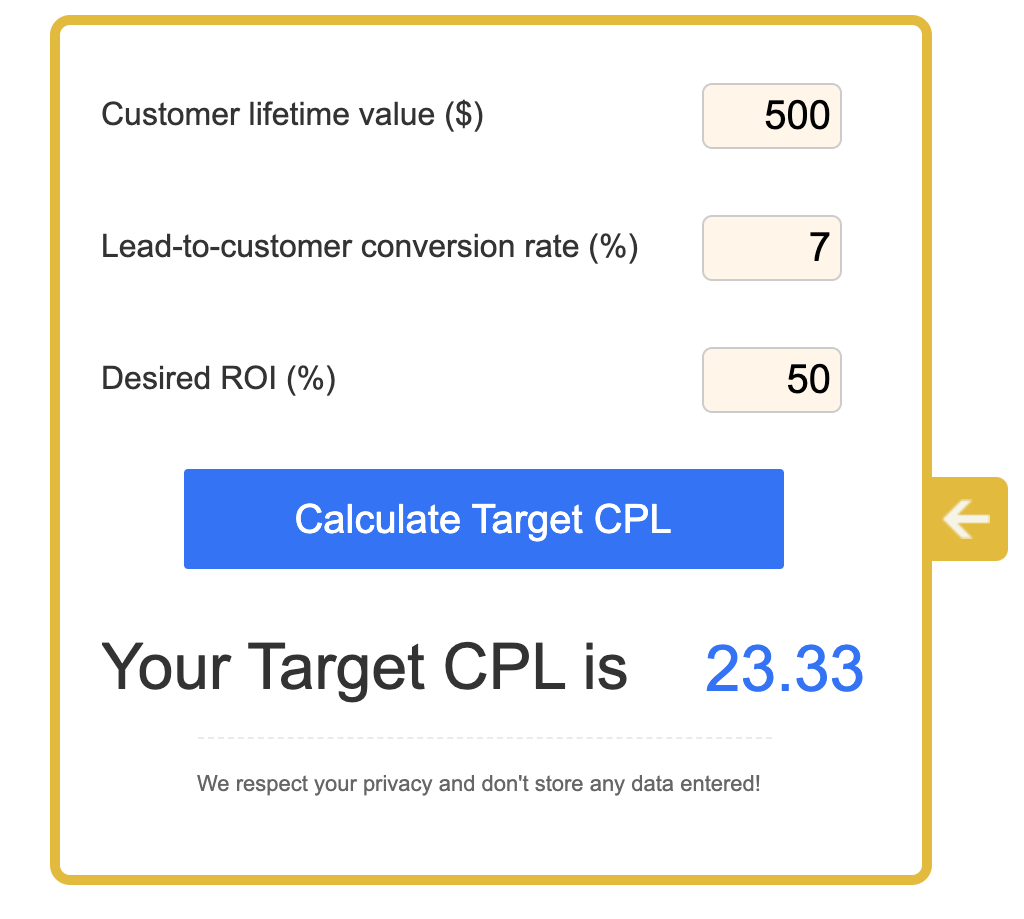
In those cases, you can work backward to figure out what your “target” CPL is based on your customer lifetime value (LTV), lead conversion rate and how much ROI you want to generate.
In other words, figure out how much you can afford to spend per lead before it’s inefficient. Inefficient could mean the return isn’t as great as other channels, you’re losing money, or any number of other things.
For example, if your CPL is $50 and you have a 10% lead conversion rate (meaning 1 out of every 10 leads will convert to a customer), it will cost you at least ~$500 to acquire one paying customer.
Based on your budget, the price of your product, and average LTV, can you afford that?
Here’s a calculator that’ll make calculating your target CPL even easier, without having to manually do a bunch of calculations.
Lead Conversion %
Your lead conversion rate is the percentage of leads that will convert into paying customers.
To calculate your lead conversion rate, divide the number of paid customers you expect to get by the total number of leads you received.
For instance, if you get 100 leads from a Facebook Ads campaign and 10 of them convert to customers, you have a lead conversion rate of 10%. (10/100).
Similar to estimating your CPL, I’d suggest looking at your past performance to estimate your lead conversion rate.
If you don’t have historical data, you can also estimate it based on your target customer acquisition cost (CAC) and customer LTV. If it costs you more to acquire a customer than they’re going to pay you over their lifetime, eventually you’re going to run out of money.
Based on your budget and goals, what percentage of leads do you need to convert in order to make a campaign financially sustainable?
Let’s say you have a budget of $1,000 to spend on Facebook Ads and your average customer LTV is $600.
Using those numbers, we can calculate what our lead conversion rate needs to be in order to keep our CAC below our LTV.
(Note: we’re using an overly simplified definition of CAC. We’re dividing our budget ($1000) by the number of converted leads. This is just to simplify the example. You can read the full definition and calculation of CAC here.)
| Lead Conversion Rate | # of Converted Leads | CAC |
| 1% | 1 | $1,000 |
| 3% | 3 | $333 |
| 5% | 5 | $200 |
| 7% | 7 | $143 |
| 10% | 10 | $100 |
Now that you have a rough estimate of what your CAC is at different lead conversion rates, compare that to your customer LTV.
Remember, your CAC should be less than your LTV. A lot of SaaS experts like Profitwell and Chargify recommend an optimal LTV:CAC ratio of 3:1. Meaning you should generate 3x as much revenue per customer as it costs you to acquire them.
Using the table above, if our LTV was $600, then our optimal lead conversion rate should be at least 5%. But I’d suggest going with the lower end to give yourself some buffer. So you might assume a 3% lead conversion rate just to be on the safe side.
I know that was a lot of math I just threw at you. But it’s actually not too much of a pain to calculate. And once you run a campaign for a month or two, you’ll have actual numbers you can use as benchmarks as well.
Conversion Time
Depending on your acquisition funnel, your leads might not convert into a paying customer the same month they come in.
For instance, at Finmark, we offer a 30-day trial. So when we run campaigns and people sign up, they might not immediately convert into a paying customer. Most people will go through a trial period first and decide whether or not they want to subscribe after their 30 days are up.
Some companies offer a shorter trial period like 7-14 days so their leads convert sooner.
You also have some leads who might go through your trial, decide it’s not right at the moment, and subscribe a month or two after.
And if you just happen to have a longer sales cycle in general (which is pretty common with higher-priced products), your leads might not convert for months.
In Finmark, you can choose how many months you want to spread your lead conversions over.
For instance, let’s say we’re running an ad campaign that pushes people to sign up for a free 30-day trial. After the first week of the trial period, we send an email to incentivize leads to sign up for a paid subscription with a discounted price.
When I add the revenue driver into our model, it might look something like this.
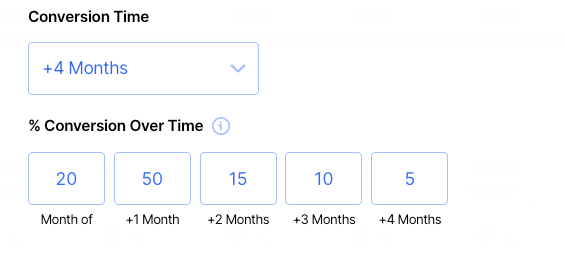
This means that we’re estimating:
- 20% of our leads will convert the first month to take advantage of our discount price.
- 50% will convert after a month when their trial is over.
- 30% will convert months after the trial period.
The advantage of spreading your conversions out over time when you build your revenue model is to make sure you’re not accounting for revenue too early.
For instance, if instead of spreading the conversions out over time, we just assumed every lead would immediately convert, we’d be under the false assumption that we have more revenue in the first month than we actually have. And that’ll lead to all sorts of problems like overspending and over-reporting numbers.
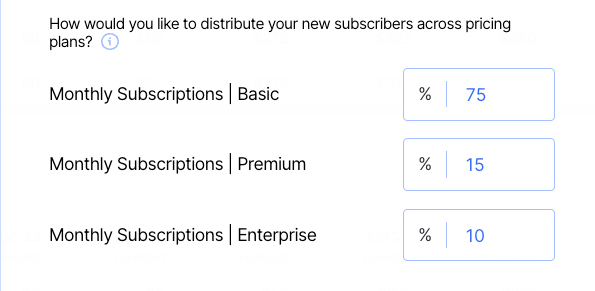
Customer Distribution
Next, you need to estimate which products your leads will likely sign up for (if you offer multiple plans and products).
You can get very granular here depending on how you define customers. For instance, you might define your customers by different geos, target segments (B2B vs B2C), company size (SMB, Mid-market, Enterprise), or something completely different.
To keep things simple for this example, we’ll stick with the “traditional” tiered SaaS pricing model I mentioned earlier:
- Basic
- Premium
- Enterprise
In general, you’ll probably get more leads converting to your lower-priced plans than higher ones, so keep that in mind when you make your assumptions.
Remember, these assumptions should be based on what’s likely to happen, not necessarily what you want to happen. It’d be great if all your converted leads subscribed to your highest price plan, but how likely is that?
Of course, you can use historical data here too. Take a look at the distribution of your current customers. What percentage are on which plans? Then use that info to make your estimates.
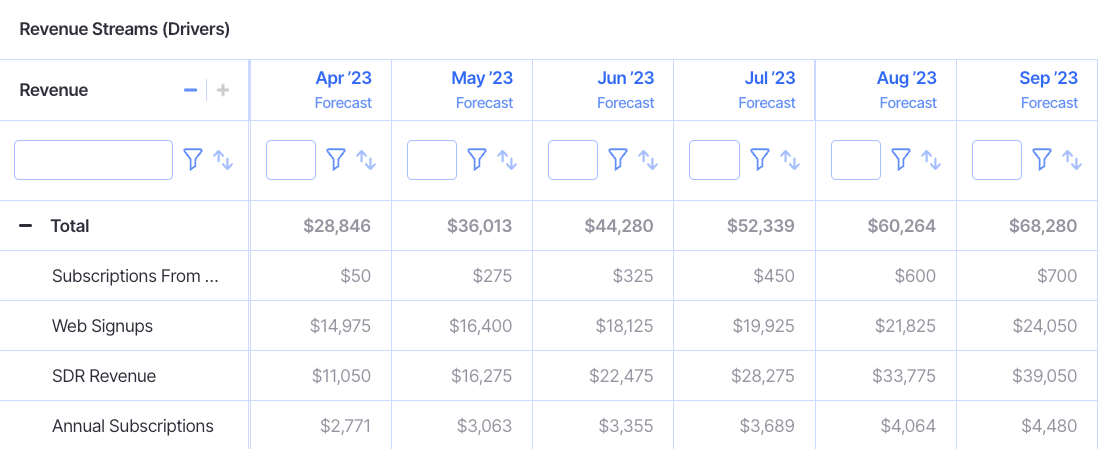
Once you fill in those assumptions, add the driver and your monthly revenue forecast will be updated.
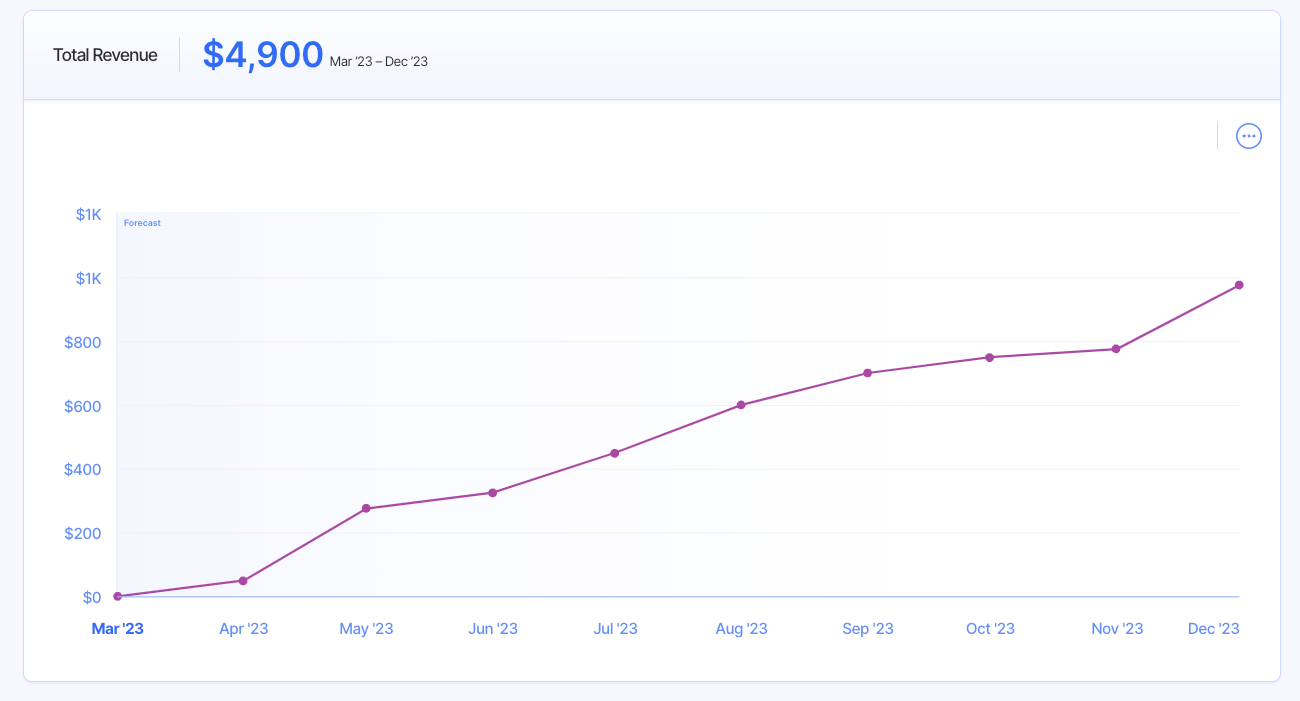
The great thing about modeling your revenue drivers in a tool like Finmark as opposed to spreadsheets is you can also create different scenarios and compare them side-by-side.
For instance, what if we wanted to see what happens if our Facebook Ads convert at 10% instead of 7%?
We can model it out and compare it.
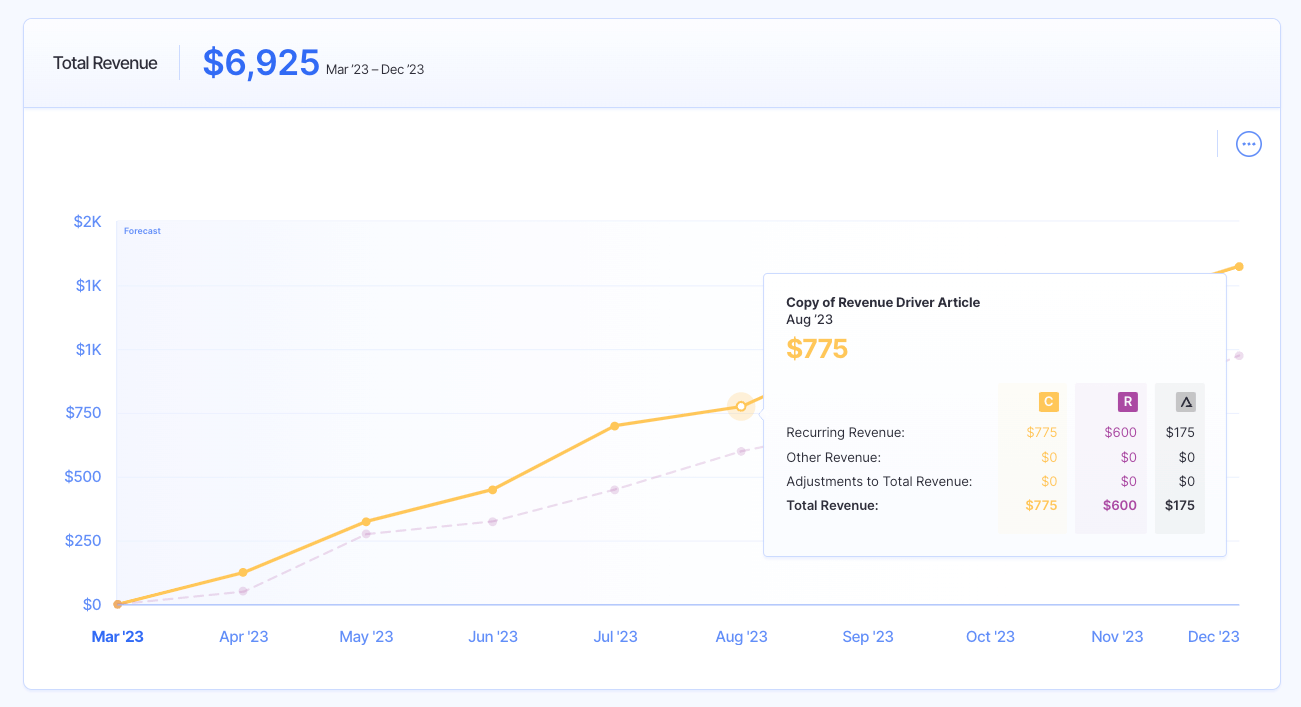
As we can see, the higher conversion rate results in faster growth and higher revenue.
Planning and analyzing multiple scenarios is a great way to think strategically about your marketing plans and set goals based on different assumptions.
Now that we’ve covered marketing drivers, let’s take a look at sales-led revenue drivers.
Sales-Led Revenue Drivers
If you have a sales team, they likely drive a big chunk of your revenue. You can model what your revenue growth looks like based on their performance.
Here’s how.
You’ll go through the same process of creating a revenue stream in Finmark. But this time, we’ll choose Sales-led conversions as our revenue drivers.
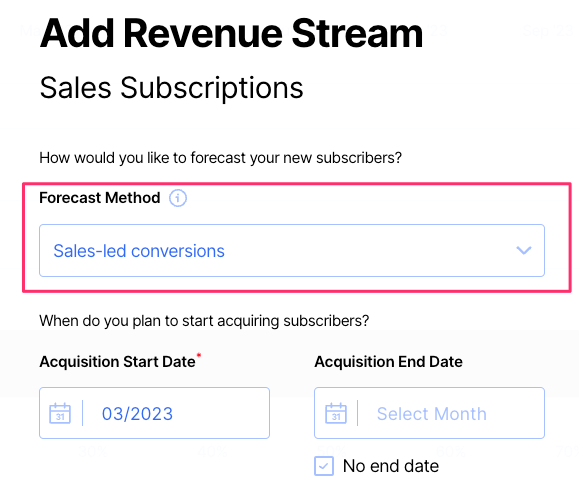
Just like with the marketing drivers, we’ll need to fill in some details to model our revenue based on sales.
Here’s an overview, and I’ll dive into the specifics of each below.
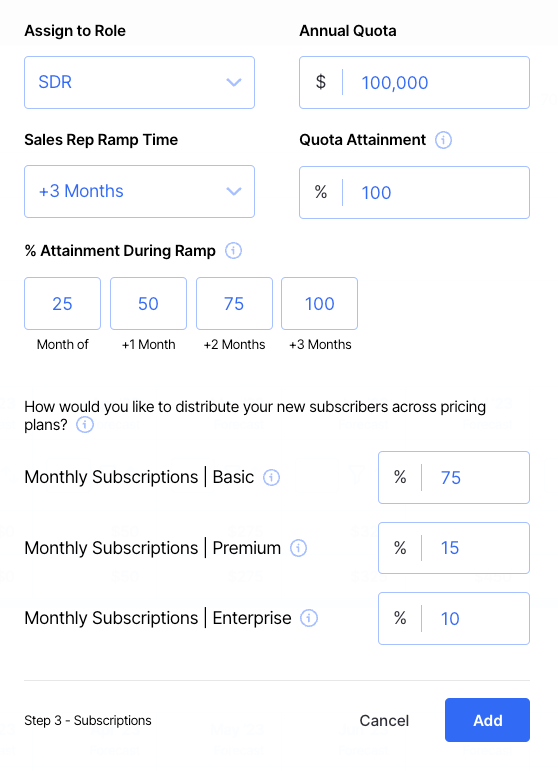
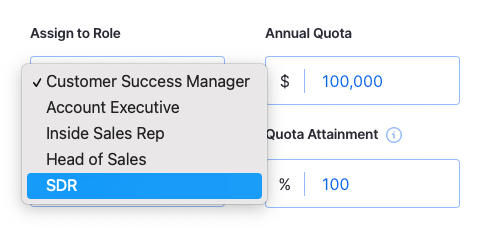
Role
The first thing you’ll want to do is attach the revenue driver to a specific role. If your sales team has different roles (i.e. SDRs, account executives, sales managers, etc) they each probably have different quotas and goals.
Annual Quota
Next, set an annual quota for the sales role. Again, this is why assigning roles to each driver is helpful. Your SDR team will have different quotas than your account executives or other roles.
This also comes in handy if you segment your sales team based on deal sizes. For instance, you might have an enterprise sales team responsible for getting larger deals, so their quota will be larger than your SMB team.
In this example, we’ll say our SDR team is responsible for generating $100,000 in revenue for the year.
Ramp Time & Quota Attainment
The next few sections go hand in hand.
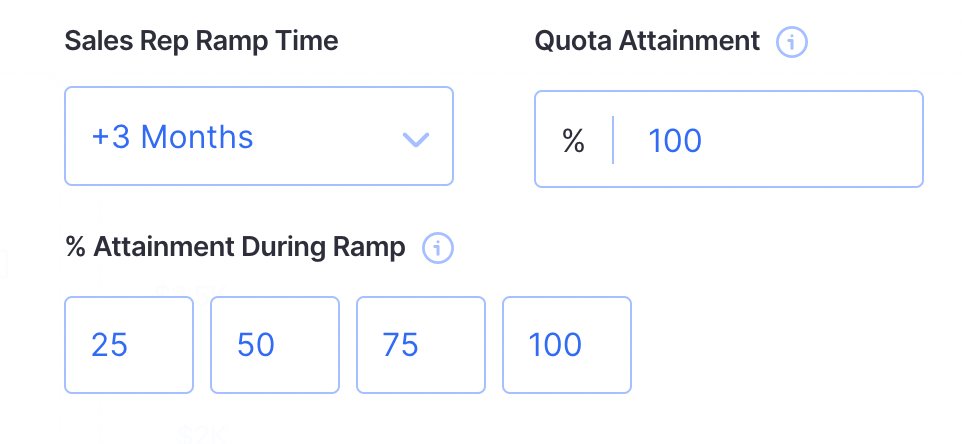
Ramp time is how many months you estimate it will take before they’re at their full momentum. In order to prevent over-estimating your projected revenue, try to be realistic here.
If you’re bringing on new salespeople or have a more junior sales team, their ramp time is going to be longer than an experienced team of people who are sales masters.
To throw another pop-culture reference at you—Dwight Schrute’s ramp time is going to be shorter than Ryan Howard’s.

For instance, if you’re an early stage startup and haven’t quite figured out product-market fit, don’t fully understand your audience’s pain points, or you’re missing some key product features, that’ll have an impact on how much your team is able to sell.
At the same time, you don’t want to be pessimistic about it. For instance, if you assume a 60% quota attainment, you probably need to just lower your quotas to something more realistic.
Last but not least, estimate what percentage of quota your team will attain during their ramp time.
Sure, it might take a few months until your team is operating at full force, but that doesn’t mean they won’t be selling anything while they ramp up.
Use this section to estimate what percentage of their quota your sales team will hit while they’re ramping up.
What Drives Your Revenue?
As simple as it may sound, that single question is something a lot of startups overlook.
Unfortunately, when you’re building your revenue model in spreadsheets, a lot of times you’re forced into making broad assumptions about your revenue growth. Most will just ask you to estimate your revenue growth but completely ignore the fact that the revenue growth has to come from somewhere.
If you want to create a more accurate model that gives you the flexibility to quickly create and tweak revenue drivers for your plan, give Finmark a try with a free 30 day trial!
Revenue Driver FAQ
What are key revenue drivers for SaaS?
SaaS companies can have a variety of revenue drivers, including marketing campaigns, salespeople, online ads, and more.
How do you determine your best revenue drivers?
Monitor the revenue growth of all of your revenue drivers over time. Pay attention to which ones are driving the most revenue, the cost associated with them, and how scalable they are.
This content is presented “as is,” and is not intended to provide tax, legal or financial advice. Please consult your advisor with any questions.