Balance Sheet Forecasting: A Guide For Beginners
Balance sheets are an important part of financial reporting, and one of three statements that make up the widely-used three-statement model.
What’s also important, however, is balance sheet forecasting: looking forward to the next financial period and forecasting what your company’s assets, liabilities, and equity should look like.
Forecasting your balance sheet can:
- Give you insights into what your company’s financial standing will look like in the future
- Help you find the biggest opportunities and potential weaknesses in your company’s balance sheet long term
- Provide the basis for strategic changes
In this article, we’ll explore the importance of balance sheet forecasting, and show you how to create your own forecasts.
What Is A Balance Sheet Forecast?
First, let’s take a step back and define what a balance sheet itself is.
A balance sheet is a formal financial statement that provides a snapshot of an organization’s:
- Assets
- Liabilities
- Owner’s equity
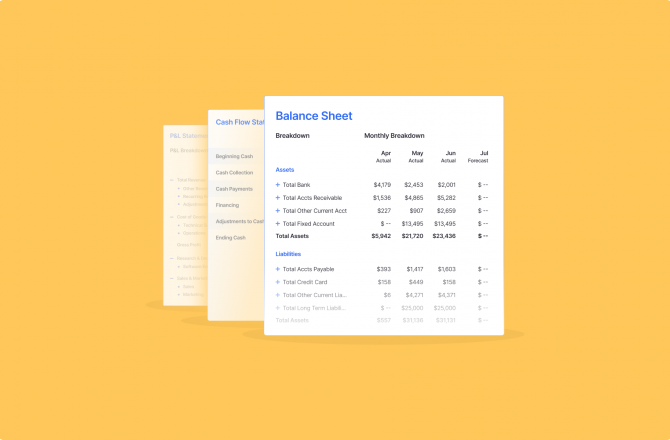
Here’s an example of a balance sheet:
Balance sheet example
Each of the three categories in a balance sheet is then broken down further into line items.
For instance, in the above balance sheet, the company’s assets are broken down into the following subcategories:
- Bank account
- Accounts receivable
- Other current assets
- Fixed assets
The balance sheet gives you important information about your company’s debt exposure and ability to repay those debts using its assets, at a given point in time.
A balance sheet forecast is a projection of what your company’s assets, liabilities, and equity will be in the future, based on your understanding of current growth, historical trends, market and industry economics, and the strategic financial initiatives you have in play currently.
Why Should You Create A Balance Sheet Forecast?
Balance sheet forecasting is an important practice for understanding how the actions you take now will impact your financial standing in the future.
Let’s say, for example, that you’re considering engaging in short-term debt financing to access some additional capital for business growth.
Creating a balance sheet forecast will be helpful here, as it will allow you to understand the impact of that debt engagement, and determine whether your company will feasibly be able to repay that debt at its due date.
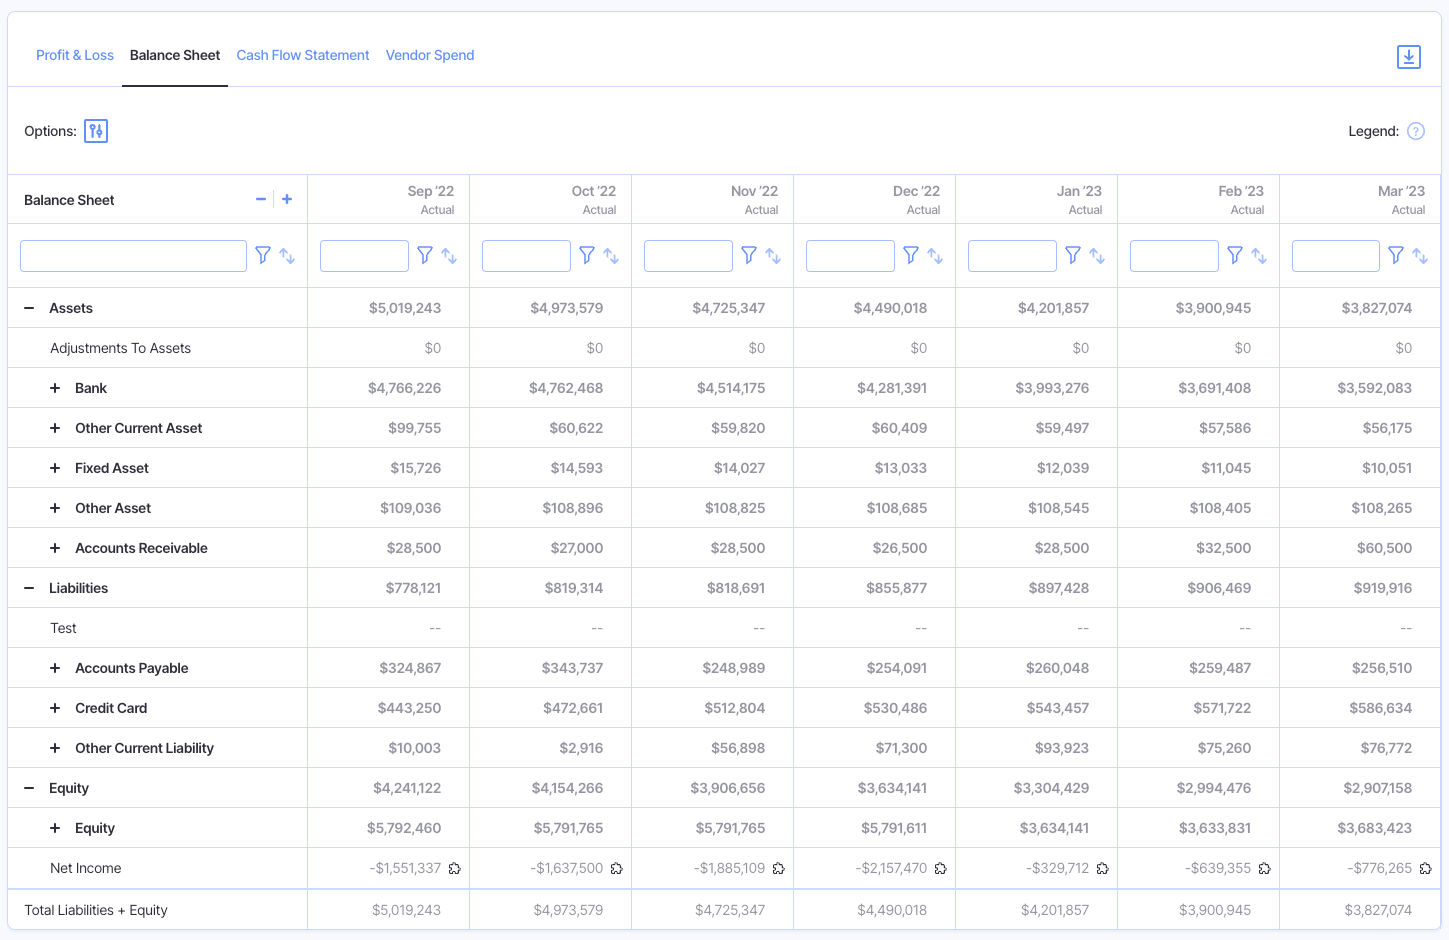
Example of a balance sheet forecast
It’s also useful for understanding how your profit & loss and cash flow statements will impact your debt levels in the future.
For instance, if your cash flow projection forecasts significant positive cash growth, then you may decide to use that to pay down some longer-term debts. You can then use the balance sheet forecast to understand the implications of that decision.
To get the most value from your balance sheet forecast, we suggest analyzing individual line items within your Assets, Liabilities, and Equity rather than just looking at the totals.
Individual line items on a balance sheet
For example, when assessing the impacts of paying down debt, you might compare the consequences of using cash to pay down current liabilities vs. long-term liabilities.
Lastly, a balance sheet forecast can be used to assess the impact of merger and acquisition scenarios, where finance teams can look at the forecasts of both businesses and understand what the financial position would be should the merger or acquisition take place.
How To Build A Balance Sheet Forecast
Building your first balance sheet forecast from scratch?
Follow these seven steps.
1. Start With Your Most Recent Balance Sheet
Your first step is to roll forward the data from your previous financial period.
For most companies, this will be fairly simple, as they’ll be building forecasts for the upcoming financial year, having recently completed their statements for the last year.
In this case, simply take your figures from the balance sheet you’ve just created, and use them as the basis for your forecast.
If you’re forecasting in the middle of a financial period, or otherwise don’t have a balance sheet prepped, you’ll need to create one now.
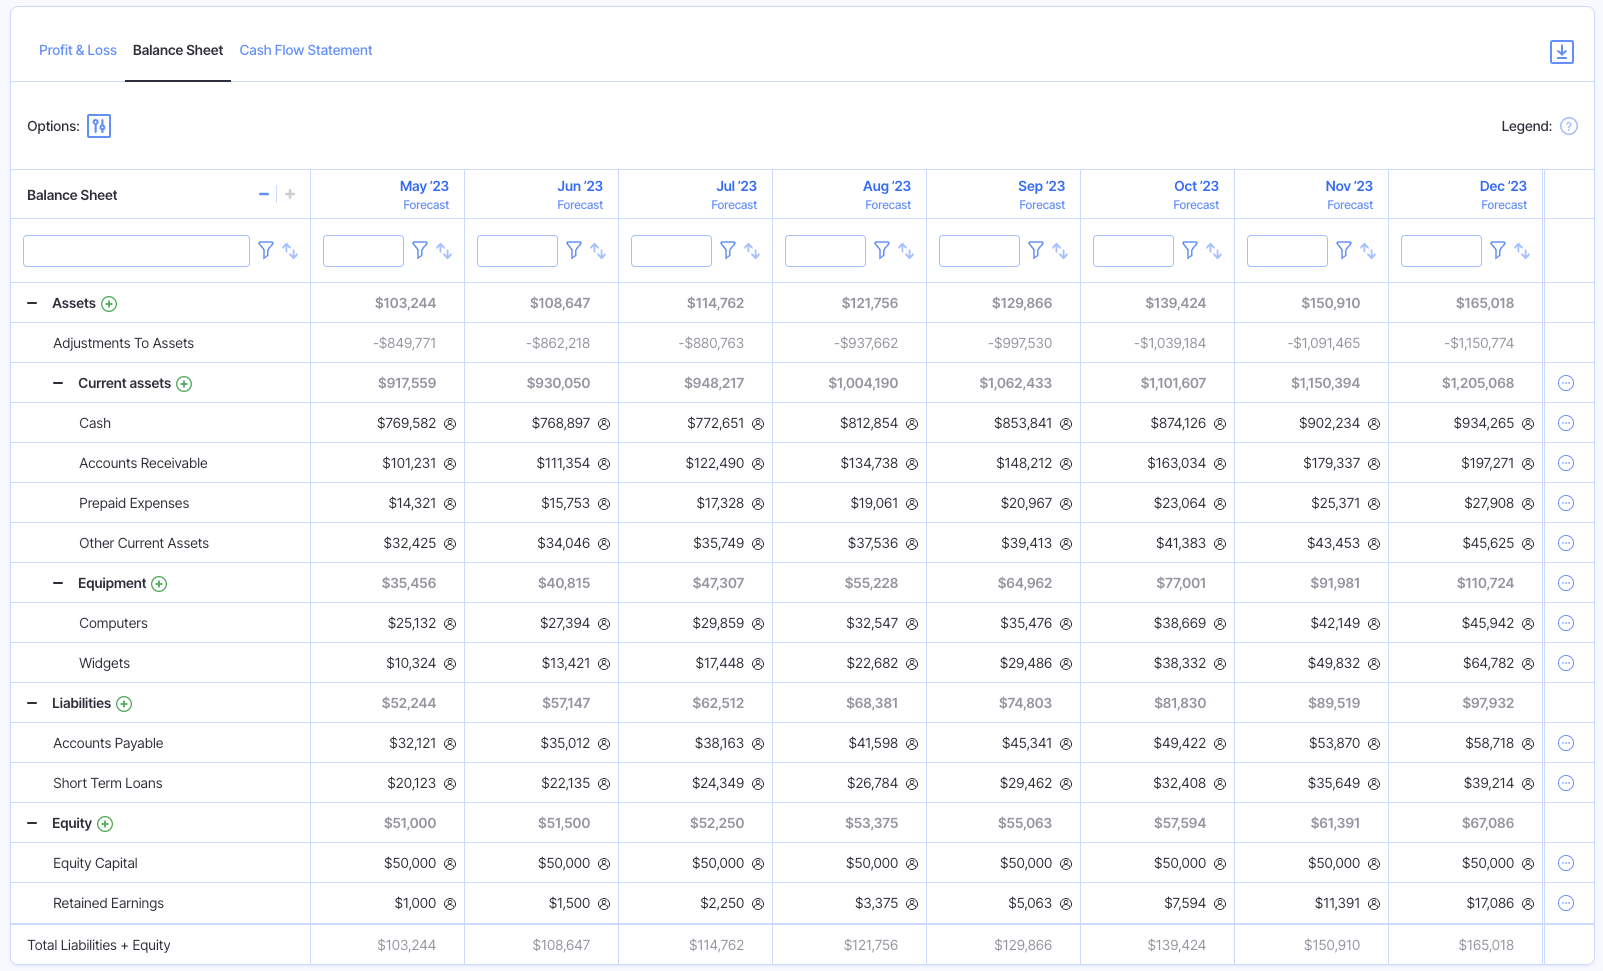
Balance sheet forecast example
2. Determine Which Accounts Should Start From Net Zero
Having rolled forward the accounts from your previous financial period, you might notice that it doesn’t make sense for every account to start from that basis.
Take, for example, your accounts payable line item.
For many organizations, this is a highly-fluctuating account, which means rolling forward the previous period’s numbers might not make sense (especially if they’re currently sitting at close to zero).
Instead, you should apply a technique known as forecasting from net zero.
In this case, you can use a percentage of key income statement accounts to forecast what your AP line should look like.
For example, you might analyze your last three years’ worth of financial data to understand that accounts payable typically represent 30% of the sum of your sales, marketing, and professional services accounts.
Then, you’ll use your P&L forecast to determine what those accounts will look like for the period you’re forecasting into, and take 30% of that number as your projection for the AP line item in your balance sheet forecast.
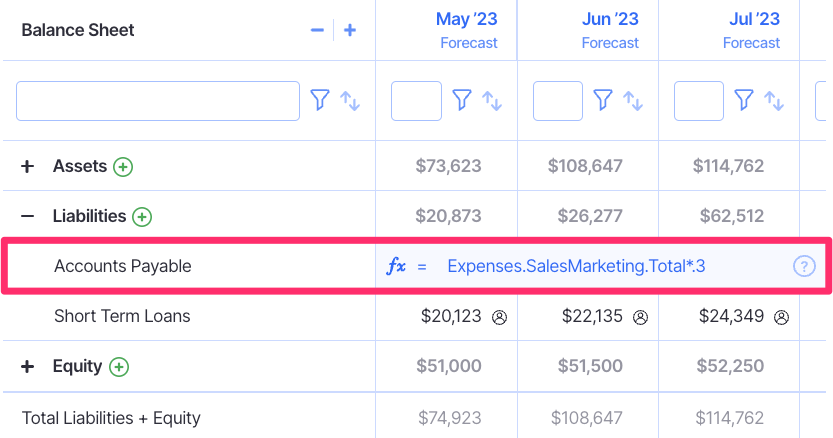
Finmark makes it easy to forecast your balance sheet using formulas
At this step, determine which accounts can be rolled forward and which require a net zero forecast approach, and apply the appropriate methodology.
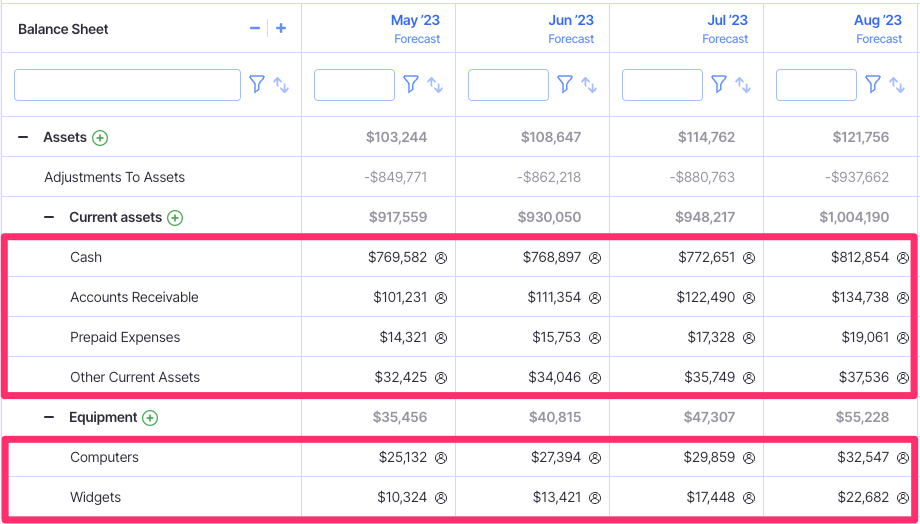
3. Forecast Net Working Capital Accounts
One of the biggest benefits of balance sheet forecasting is the ability to understand your net working capital.
Net working capital is a measure of short-term financial health and is basically the difference between your current assets and liabilities. You want the difference to be positive (meaning you have more current assets than liabilities).
Your main inputs on the assets end are accounts receivable and cash on hand, while liabilities will consist of accounts payable and other debts due soon.
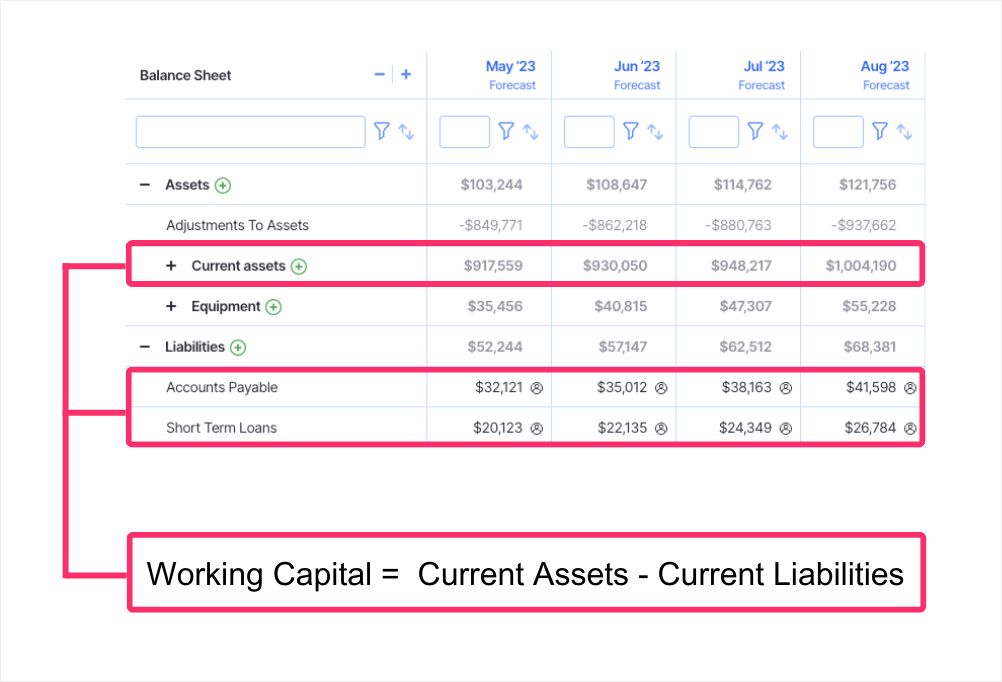
Calculate working capital by subtracting current liabilities from your current assets in your balance sheet
Use historical data to forecast what these accounts will look like in the next financial year.
For example, you might find that your AR typically looks like 50% of revenue for the month. Review your revenue forecasts (from that P&L projection), and calculate what your net working capital accounts will look like as a result.
4. Pull In Data From Your Cash Flow Projection
Your cash flow projection should be your next source of data for building a balance sheet forecast.
This links in with the above point, as your cash flow projection informs what your cash-on-hand account looks like for the upcoming financial period.
Open up your cash flow projection, find the closing account for the period for which you’re forecasting, and add that to your balance sheet.
If you’ve not yet built out a cash flow projection, check out our guide for a play-by-play: How to Create a Cash Flow Projection: Step-by-Step Guide.
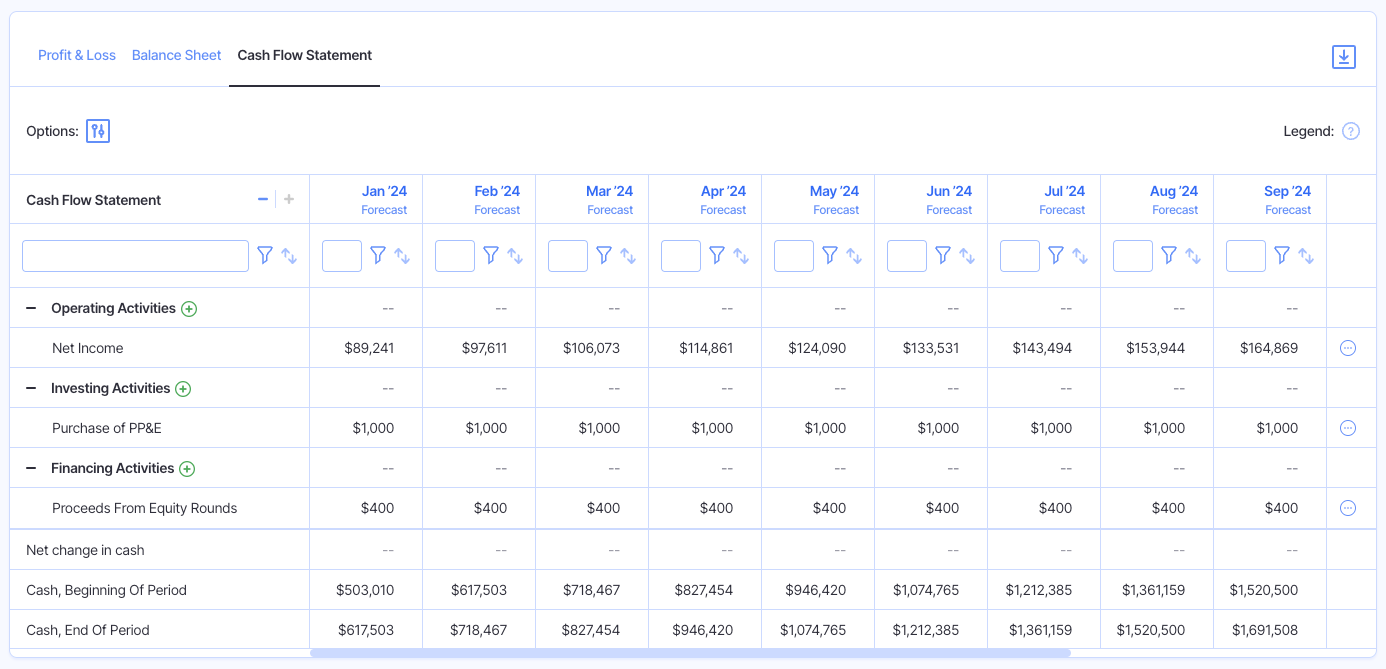
Example of a cash flow projection
5. Consider The Impact Of New Strategic Initiatives
At this point, you’ve got a pretty reliable forecast based on historical data.
But this assumes that things are simply going to continue as they have been, which is likely not the case.
A more likely scenario is that you have strategic plans in place for future growth, which are going to impact what your balance sheet looks like.
Say, for example, that you plan to offer all existing monthly subscribers an annual plan, something you haven’t had available previously.
You anticipate that a certain percentage will agree to the offer, which is going to have significant impacts on both accounts receivable as well as cash on hand.
Consider the implications of strategic initiatives such as these, and incorporate those expectations into your balance sheet forecast.
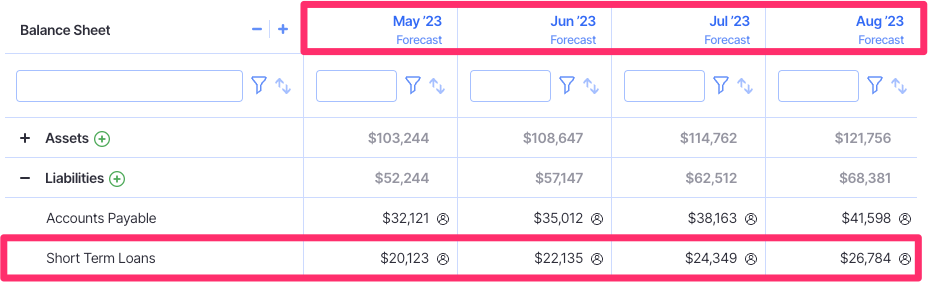
6. Account For Upcoming Funding Rounds
This step isn’t going to apply to every business, nor to every time you create a balance sheet forecast. However, it is a critical consideration for any companies who expect to raise a new funding round in the upcoming financial period.
That’s because new funding will heavily impact your cash account, and either your long-term liabilities or owner’s equity accounts, depending on whether your raise debt or equity financing.
First, determine how much you expect to raise in cash during the upcoming period, and add that amount to your forecast.
If you’re going down the debt route, then create a new line item under your long-term liabilities header, or add the debt amount to an existing ledger item.
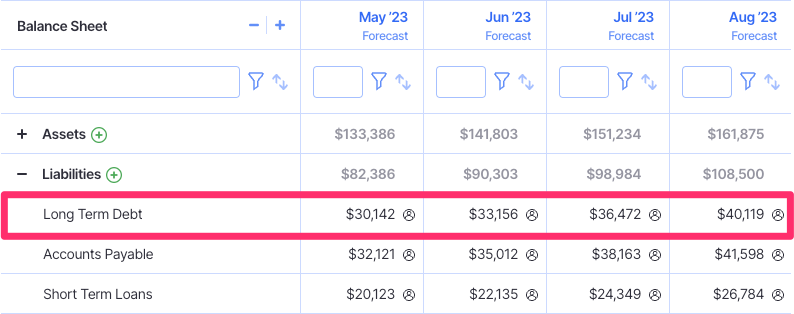
Adding debt to a balance sheet
If you raise equity financing, adjust your shareholder’s equity line items, and make sure the percentages match up with your cap table.
7. Build Upside/Downside Scenarios
While balance sheet forecasts are super helpful for looking at future company performance, it’s important to bear in mind that they are forecasts.
That is, they’re an estimate of what your financial position will look like at the end of the upcoming year, using your assumptions about growth rates, market conditions, and strategic initiatives as a basis.
But even the best-laid plans can go awry, and it’s critical to be prepared for situations where your forecasts are a little off.
The best way to prepare yourself here is to use scenario analysis to build upside and downside forecasts.
For instance, you might build one forecast where revenue is 10% higher than expected and one where it’s 10% lower.
This will allow you to see if you’ll still be in a safe position if revenue doesn’t quite meet budget and to put a contingency plan in place for additional investment should revenue grow faster than anticipated.
Here’s an example of two scenarios for a balance sheet compared side-by-side. Notice you can see the variance for each line item in the last column. This makes it easy to identify the exact source of any positive or negative variances in each scenario.
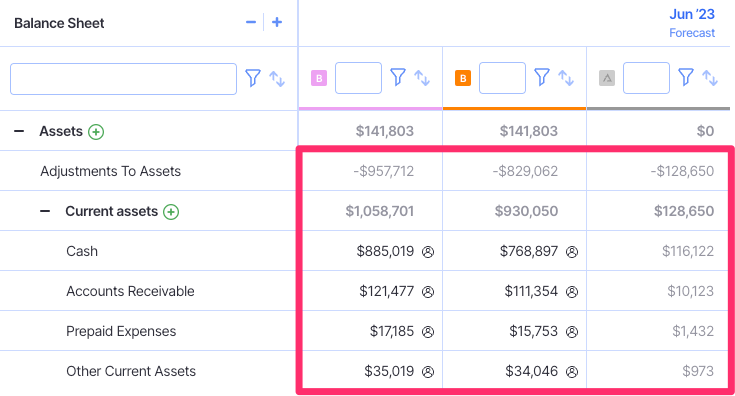
Comparing assets in a balance sheet for two different scenarios
Learn more about the steps involved in this process with our guide: How to Do Scenario Analysis: Step-By-Step Guide.
Building Balance Sheet Forecasts Faster With Finmark
Building a balance sheet forecast is a necessary practice, but it can be a bit time-consuming to build them out on a regular basis.
The most effective finance teams put focus on reducing the percentage of time the spend creating reports, and increasing the time they spend analyzing them.
That’s where we come in.
Finmark from BILL can be used to create your balance sheet forecast faster, providing you with an up-to-date projection without the need for hours of report creation.
Just integrate your accounting platform with Finmark, pull through your existing balance sheet, and determine which variables you’d like to consider when building out the forecast (like the possibility of future funding).
Try it out for yourself with a free 30-day trial of Finmark, the financial modeling and planning platform.
Contributor
This content is presented “as is,” and is not intended to provide tax, legal or financial advice. Please consult your advisor with any questions.