Revenue Forecasting: 3-Step Guide
Revenue forecasting is one of the most powerful tools at your disposal when it comes to financial planning. It helps you set goals, plan for the future, and make smarter decisions about growth.
However, your revenue forecast is only as effective as you make it. That’s why we put together this guide.
We’ll walk you through how to forecast revenue step-by-step. We’ll also give you some tips from CFOs and finance experts to avoid common pitfalls companies make with their revenue forecast.
What is Revenue Forecasting?
Revenue forecasting is the process of estimating what your revenue will be over a specific time period—typically quarterly or annually—based on your historical and current performance.
For instance, if you want to know how much revenue you’ll generate next month, next quarter, or next year, a revenue forecast will show you where you’re headed at your current pace.
Your forecast is based on your past performance and the current state of your business. It is not a guess! That’s why it’s important to use data to build your forecast, which we’ll dive into a little later.
Revenue Projection vs. Forecast
While some people use the terms “revenue projection” and “revenue forecast” interchangeably, they’re not quite the same thing.
Let’s look at the definition of each, according to the Association of International Certified Professional Accountants (AICPA).
Forecast: “A financial forecast is based on the responsible party’s assumptions reflecting the conditions it expects to exist and the course of action it expects to take.”
Projection: “Prospective financial statements that present, to the best of the responsible party’s knowledge and belief, given one or more hypothetical assumptions, an entity’s expected financial position, results of operations, and cash flows.”
The above excerpts can be found in this document on the AICPA website.
Essentially, the main difference is revenue projections account for hypothetical scenarios that may or may not happen.
Here’s another way to think about it.
A revenue forecast says “this is how much revenue we expect to generate based on our current conditions.”
A revenue projection says “this is how much revenue we project if X happens, and here’s how much we project if Y happens.”
Revenue Forecasting Models
There are a variety of forecasting methods to choose from. Each has its pros and cons depending on your company’s situation.
Bottom-Up Forecasting
Bottom-up forecasting uses product and customer data (drivers) to forecast revenue.
For instance, say you own a monthly subscription box company with multiple pricing tiers. You get customers from Google, influencer marketing, Instagram ads, and email marketing.
With a bottoms-up forecast model, you would analyze the data for each channel and pricing tier, and use that to form your revenue forecast.
Jay Jung, president and founder of Embarc Advisors, recommends a bottom-up model for more accurate forecasts.
“Most companies target a growth rate as a goal. Then they apply a percentage of revenue for other costs and expenses. However, to develop a forecast that is higher in accuracy and aligned with strategic direction, the forecast should be developed bottoms-up based on business drivers e.g., direct response ad spend, or sales team capacity etc.”
Top-Down Forecasting
As the name implies, a top-down forecast is the opposite of the bottoms-up approach. Instead of starting from detailed drivers, you begin with a macro view of your business and industry and work down to revenue.
With this method, you’ll start by looking at the total addressable market for your industry. Next, you’ll calculate your potential market share. Then you’ll use that figure to forecast your potential revenue.
If you’re interested in this approach, Wallstreetprep.com has a free calculator available.
Pipeline Revenue Forecasting
Pipeline revenue forecasting forecasts revenue based on your sales pipeline. You’ll look at the deals you currently have in your pipeline and estimate what percentage of those deals are likely to close.
The accuracy of this method depends almost entirely on how accurate your sales forecast is. If your sales team has a good track record of predicting what percentage of leads they can convert, pipeline revenue forecasting can be pretty effective.
It’s also worth noting that this forecasting method is primarily used by companies with longer sales cycle.
Longer sales cycles allow you to gather data on how well your sales reps perform, how leads react, and other data points you need for accurate forecasting.
So this method could make sense for an enterprise SaaS company with a large average contract value, since those deals typically take a while to close.
However, since a retail store doesn’t generally have a sales pipeline, it probably wouldn’t make sense for them to use pipeline revenue forecasting.
Moving Average
A moving average revenue forecast analyzes trends in your historical performance. Rather than looking at your average revenue growth over the past one or two years, this forecasting method analyzes shorter periods—months or quarters.
An example of when this revenue forecast method is helpful is for seasonal businesses.
For instance, say you’re a company that sells custom Christmas trees, but occasionally offers other holiday-related greenery throughout the rest of the year.
Using the moving average forecasting method, you can look at the ups and downs of your revenue throughout the year and base your forecast on that data.
November and December would likely see big spikes, but periods like August and September might be slower.
Using that information, you can forecast your revenue accordingly and make strategic decisions about managing cash flow, hiring, marketing, and ordering supplies.
This method is also similar to time series revenue forecasting.
Linear Regression
Linear regression is more of an analysis technique than a revenue forecasting method.
It involves analyzing the relationship between two variables to see how they affect revenue. The most commonly cited example of this is sales and profit.
Sales and profit are closely related. In an ideal scenario, profit would grow alongside sales (even if it’s at different rates).
However, when sales are growing but profit is flat or even declining, it could indicate a problem in your growth strategy. You may need to adjust pricing, cost of goods sold, or any number of variables.
Linear regression gives you a starting point to analyze potential issues with your revenue forecast.
Straight-Line
Straight-line forecasting is the simplest model. Straight-line forecasts assume that your revenue will continue to grow at the same rate it has historically.
If your revenue has grown 15% for each of the past two years, the straight-line forecast method assumes that same growth rate for the current year.
While this method is arguably the easiest approach, it may not always be the most accurate. As the saying goes, “past performance is not indicative of future results.”
Meaning that just because you’ve historically achieved a 15% growth rate, you can’t always assume that growth rate won’t drastically change next year.
Still, the straight-line forecasting method gives you a good foundation to build upon.
Why is Revenue Forecasting Important?
There are a ton of benefits to forecasting your revenue.
Just like with financial planning, scenario analysis, and financial modeling, revenue forecasting is all about preparing your company for whatever the future holds so that you’re not caught by surprise and can make the best decisions to grow your business.
Here are a few key reasons why you should forecast revenue.
Build a Realistic Budget
Business finances are similar to personal finances.
With personal finances, you plan your budget based on your income. If you get paid $5,000 per month from your job, you know you can’t afford to spend more than that.
Aside from your fixed expenses (rent, utilities, etc.) you can also budget for things like food, going out, and other variable expenses as long as they’re within your income.
The difference with a business, though, is your revenue is rarely the same each month.
Your future revenue can fluctuate depending on how much you sell, churn, and overall market conditions.
This can make it difficult to budget for operating expenses like marketing or new expenses like hiring employees.
Revenue forecasting helps bridge that gap, particularly for operating expenses. Your forecast gives you an estimate of how much revenue you’ll generate over the next few months, or the entire year. This will allow you to know how much you can budget for marketing campaigns, new hires, software, and other expenses that change over time.
Plan For New Hires
I mentioned new hires above, but it’s worth pulling out into its own section.
Hiring is unique because unlike some other expenses, it usually needs to be planned months in advance and your revenue plays a significant role in your hiring decisions.
When you’re thinking of hiring a new employee, you need to be sure you’ll be able to afford them long term, not just in the moment.
If your revenue forecast shows revenue increasing over the next 12 months, that might give you the assurance that you’ll be able to afford to grow your team.
The opposite is also true though.
If your forecast shows a decline or slowdown in revenue growth, your hiring plan might be more conservative.
Prepare for Investors
If you’re planning to do a fundraising round, or have current investors, they’re going to expect to see a revenue forecast for your business.
Your revenue forecast will allow you to give them numbers based on data, not just what you “hope” to reach. Sure, you might want to bring in $1M in revenue next year, but does your revenue forecast support that?
That’s why a revenue forecast is a must-have when meeting with current and potential investors.
How to Forecast Revenue
Now that we’ve covered some background information and set the stage, let’s dig into how to build a revenue forecast!
Instead of giving you generic tips, though, we’re going to walk through an example revenue forecasting process step-by-step.
We’ll do it using a fictional SaaS company that sells drag-and-drop design software for small businesses.
In this example, I’m the founder and I want to forecast revenue for the next 12 months. Here’s what the process looks like:
NOTE: Your process may look slightly different depending on the forecasting method you choose.
1. Choose a Revenue Forecasting Software/Tool
First, you need a tool to build your revenue forecast. You have a couple of options:
- Spreadsheet
- Dedicated software
A lot of companies use spreadsheets for revenue forecasting. However, there are several downsides to going that route, which we touch on in this article.
When given the choice between complex spreadsheets and a dedicated tool that’s easier to use, I’ll go for the dedicated tool nine times out of ten.
And that’s the case here.
For this example, I’m going to use Finmark to build our revenue forecasting model. Not only is it our own software, but it makes the process extremely simple.
If you want to follow along, or if you just want an easier alternative to spreadsheets, you can try Finmark for free here.
If for some reason you prefer to use a spreadsheet or another tool, you can use the same approach I’m taking here, but the process will be different depending on the tool you’re using.
2. Add Your Products
Since we’re forecasting revenue, we need to make sure all of our products and revenue streams are included in our forecast.
We’ll start with products.
Products are the items you sell. They could be physical products, subscription plans, or whatever else you’re selling.
For our fictional company, our main product is our subscription, which we offer in three different plans:
- Basic – $100/month
- Pro – $250/month
- Premier – $500/month
Let’s add those into Finmark. You’ll just need to fill in the plan name, price, subscription frequency (monthly, quarterly, or annually), and churn rate for the plan.
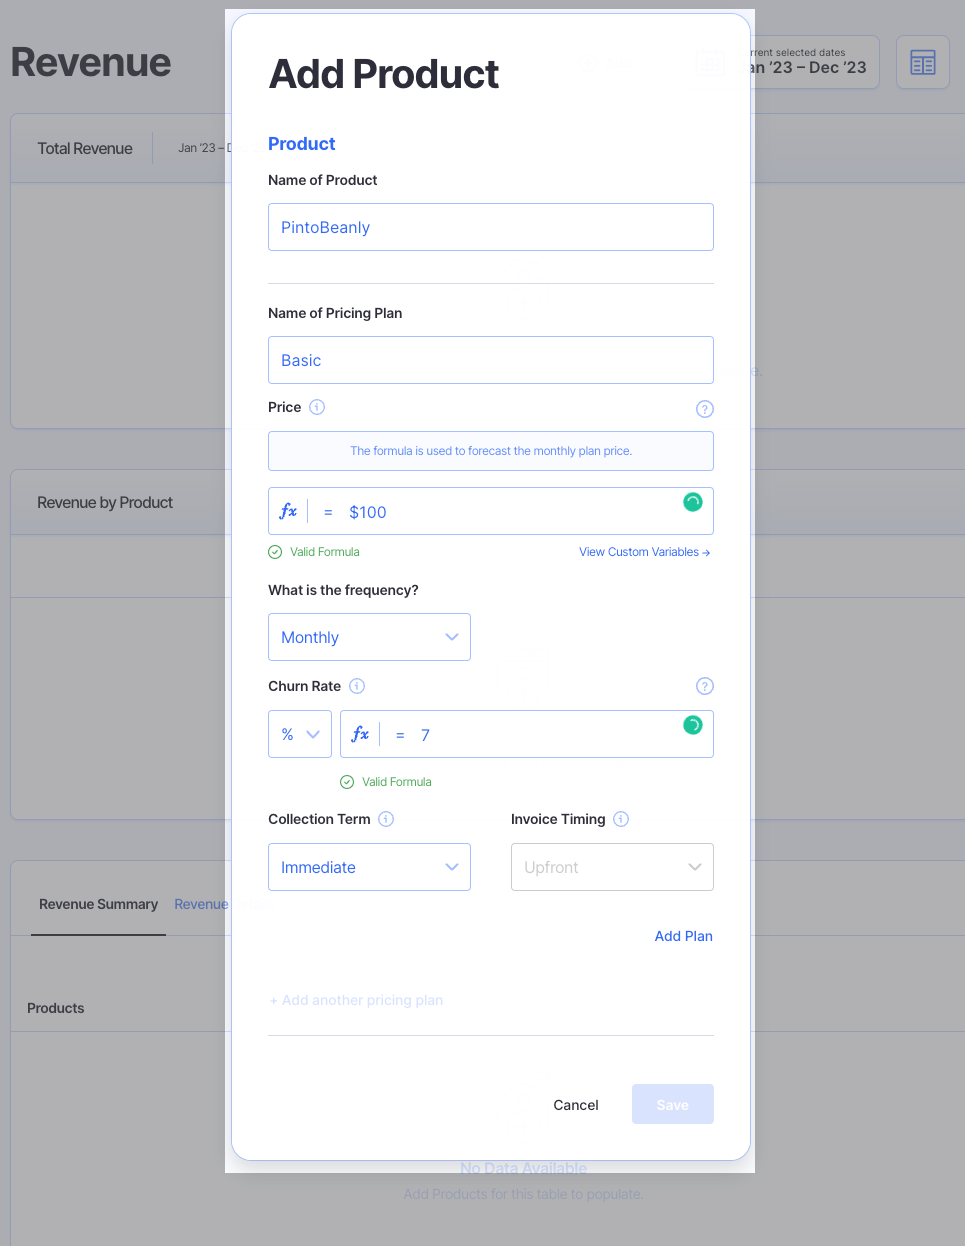
If you’re unsure of what your churn rate is, check your actuals. If you don’t have the data on-hand, you can estimate. However, we highly recommend using actuals here so your forecast is as accurate as possible.
You’ll repeat the process for all of your individual plans.
Here’s what all of our plans look like once we’ve added them:
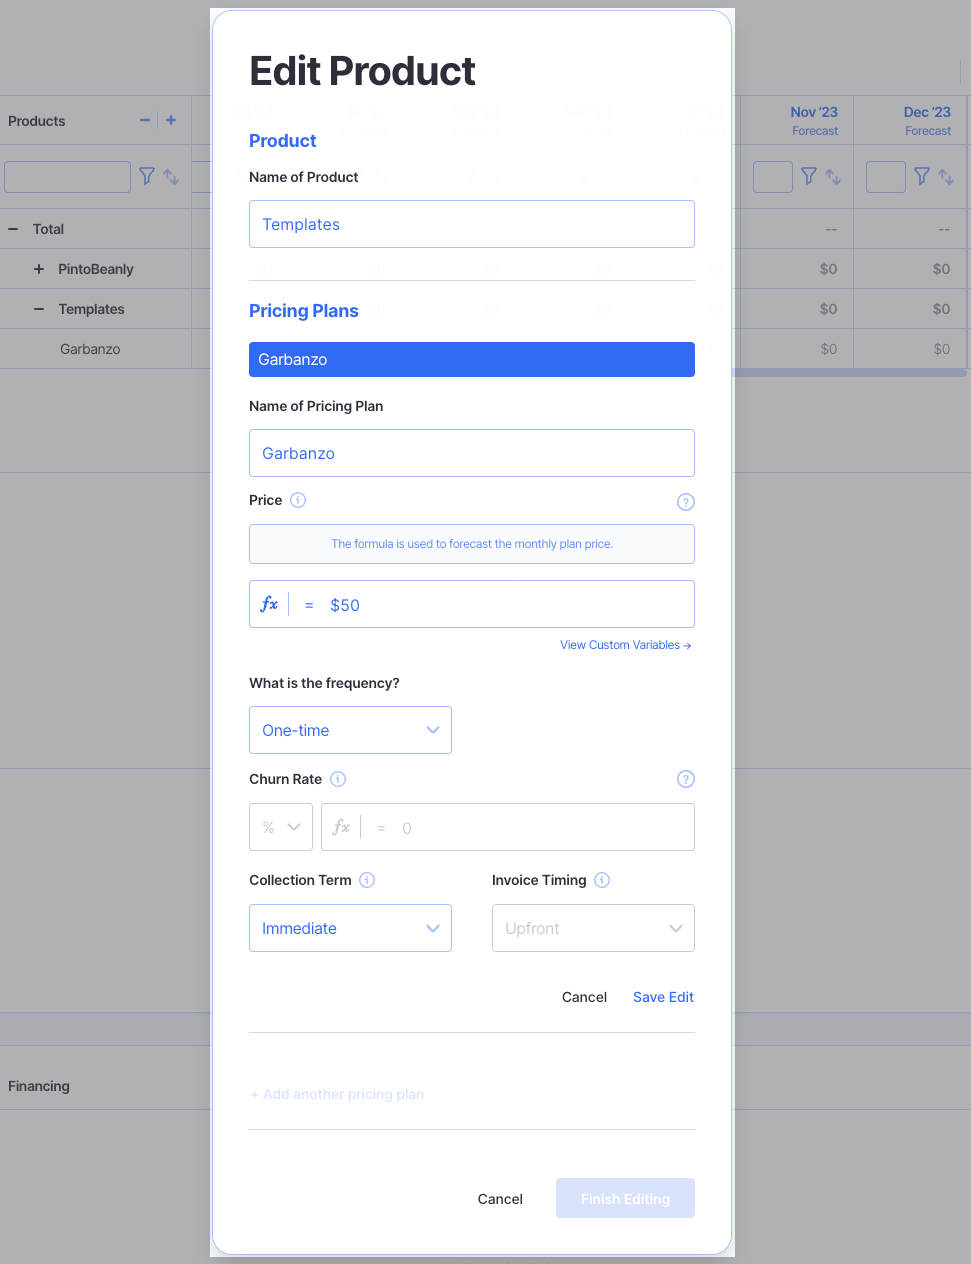
If you have non-recurring revenue, you can add that in too.
For instance, let’s say our company also sells templates customers can use with our software. They pay a one-time fee for each template and they can use it as much as they want.
We can add that in as a separate product.
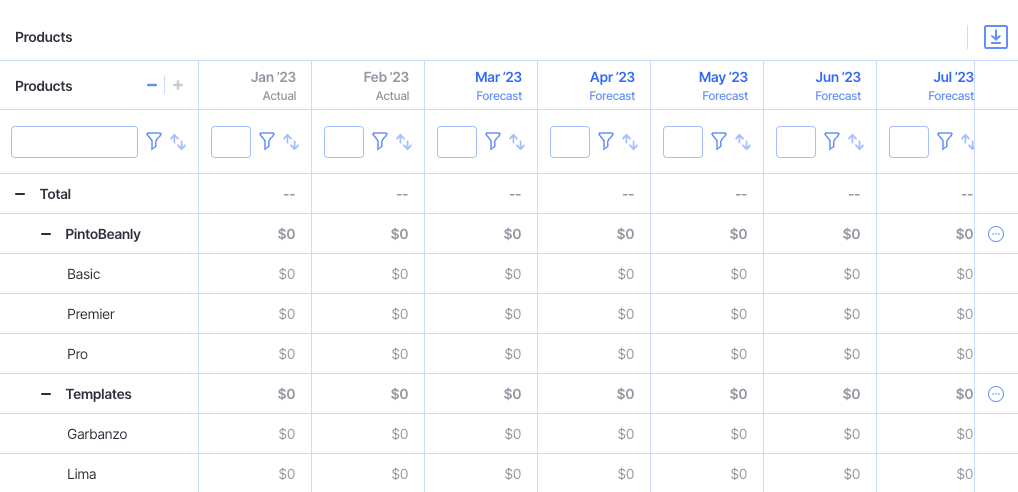
If we sell multiple templates, we can add them all in. So here’s a look at all of our products.
Once you’ve added in all your products, you can move to the next step.
3. Add Your Revenue Streams & Drivers
We have our products added. Now we need to set up revenue streams and drivers for them.
We’ll start with revenue streams.
A revenue stream is the way we make money from the products we added in step two.
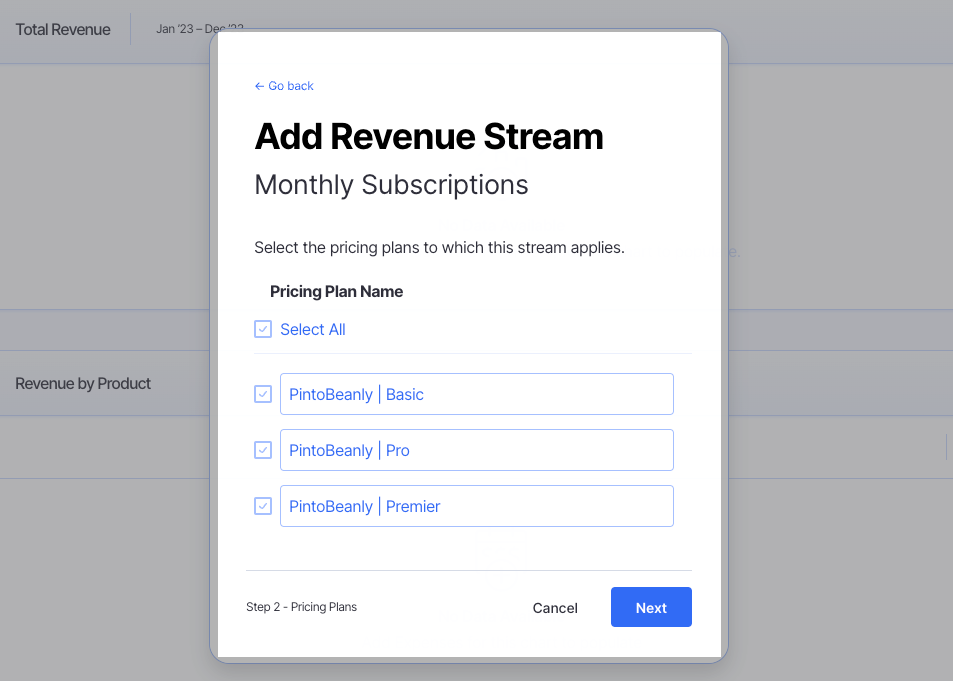
We’ll start with our subscription plans. We’ll add a revenue stream called “Monthly Subscriptions” since that’s how we’ll make money from each plan.
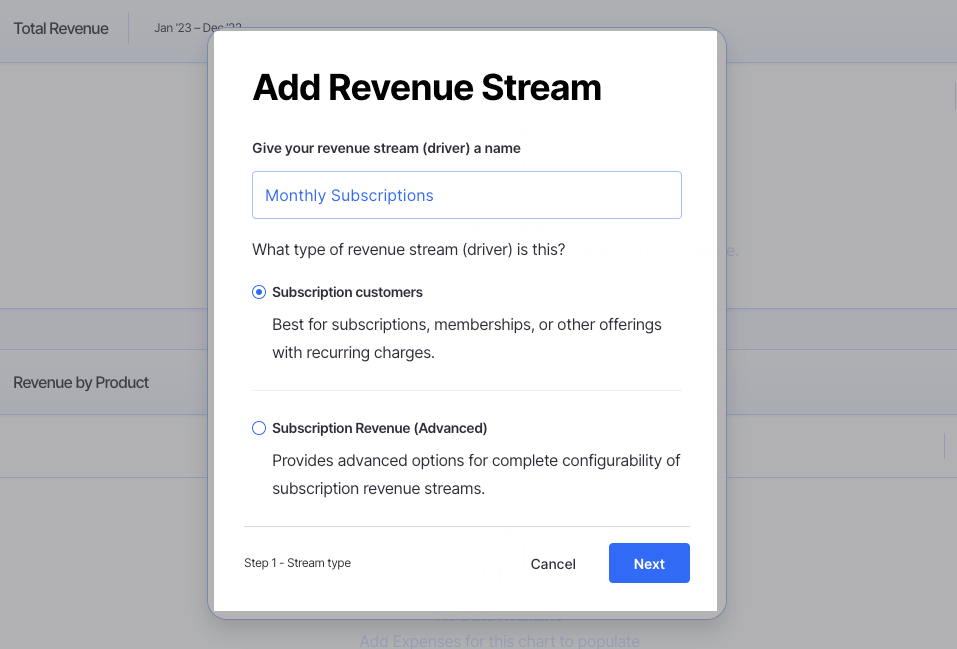
We’ll add all three of our subscription plans to this revenue stream.
With those added, we can move onto our revenue drivers.
A revenue driver is what your revenue growth is based on.
If you project you’re going to grow your subscription revenue 5% month over month (MoM), what is that 5% based on?
In Finmark, we give a few options for revenue drivers:
- Base subscribers with monthly growth: Build your forecast based on your expected monthly growth rate. This is a great option, particularly to start out with. You set your initial number of customers and then a projected growth rate for each month.
- Marketing led conversion: Build your revenue forecast based on conversions from marketing campaigns. If you use ads or other paid marketing channels to acquire customers, this is a great option to forecast the revenue you’ll generate from those channels.
- Sales led conversion: Build your forecast based on sales quotas. If you have a sales team, particularly outbound sales with quotas, this method will help you forecast the revenue they’ll drive.
- Custom: Manually build your forecast by entering your projected customer growth for each month. This option is mainly used if you’ve built your model in a spreadsheet and just want to port the data over.
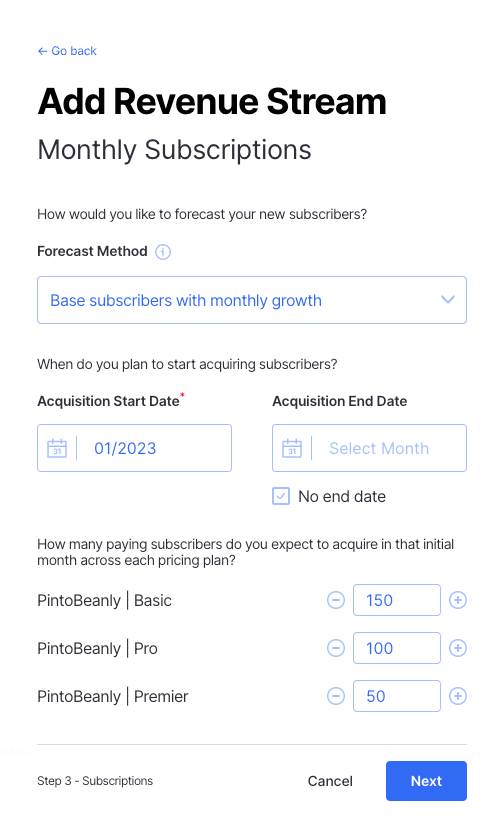
For this guide, we’ll stick with just the base subscribers with the monthly growth option.
It’s the simplest and most straightforward way to forecast revenue. If you want to see how to forecast with marketing and sales led conversions, check out this guide.
To forecast our growth, we’ll just need to input a few details.
- Acquisition start date: What month do we want to start forecasting from?
- Acquisition end date: If there’s a date you expect to stop acquiring leads, you’d enter it here. This is good for time-specific campaigns (i.e. summer sale) or if your revenue growth changes over time due to seasonality.
- Initial customers: How many customers will you acquire on the acquisition start date? This is the base number of customers for your forecast. If you already have existing customers, you can enter those numbers here.
Here’s what we’ve entered for our fictional company.
Lastly, we need to enter our expected monthly growth rate. How much do we expect our customer count to increase each month?
This step is very important. The growth rate you put here should be based on data. On average, how much have you historically grown your customer count MoM?
If you’re a new company and don’t have historical data, you can work backwards based on your revenue and customer goals for the year.
Here’s a rough example of how it might work.
If you have a goal to generate $200K ARR for the year, calculate how many customers you need to acquire in order to reach your goal.
Two-hundred thousand dollars of ARR works out to roughly $16.6K MRR. Now, let’s say you’re currently generating $6K MRR and have 120 customers. You need to add an additional 10.6K in new MRR throughout the rest of the year to reach your goal.
Your average revenue per account (ARPA) is $50 (6000/120). So you need to add about 212 new customers (10.6K/50) to reach your goal of $200K ARR. Based on those numbers, with a growth rate of about 5%, we can reach our goal in 12 months.
That was a lot of math–I know!
Luckily, if you have actuals, you can skip that. You’ll just enter in your historical growth rate (try to stick to your average growth rate from the past 3-6 months) and Finmark will handle all the calculations for you.
Back to our fictional company. We have historicals, and it shows that we’ve grown 8-15% MoM for the past six months. To avoid overestimating our growth, we’ll choose a conservative growth rate of 8%.
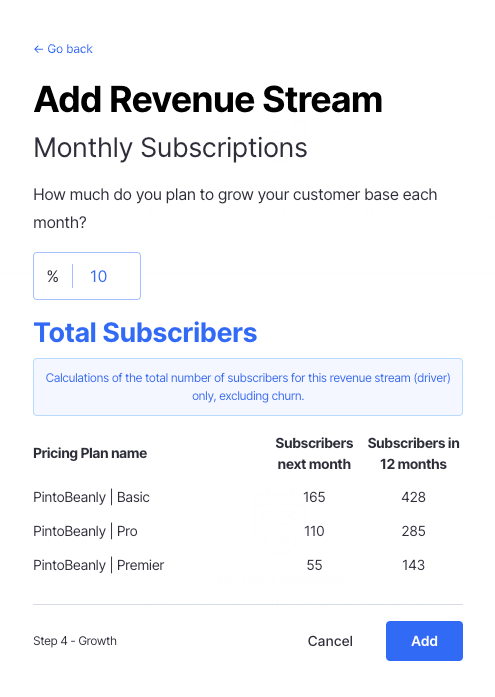
Here, we can see what our forecasted number of new customers will be in 12 months. Once we click Add, we’ll be able to see our revenue forecast.
We also need to repeat the same process for our template sales. The key difference is your Revenue Stream type will be One-Time purchases instead of Subscription customers.
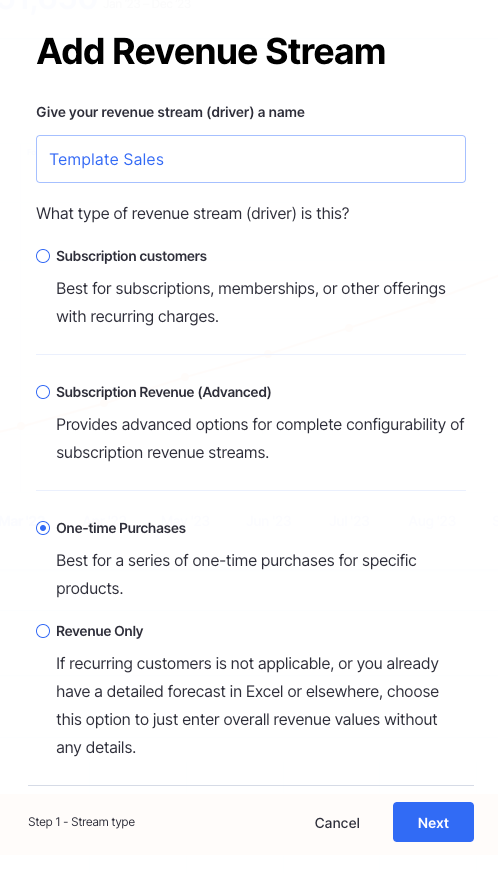
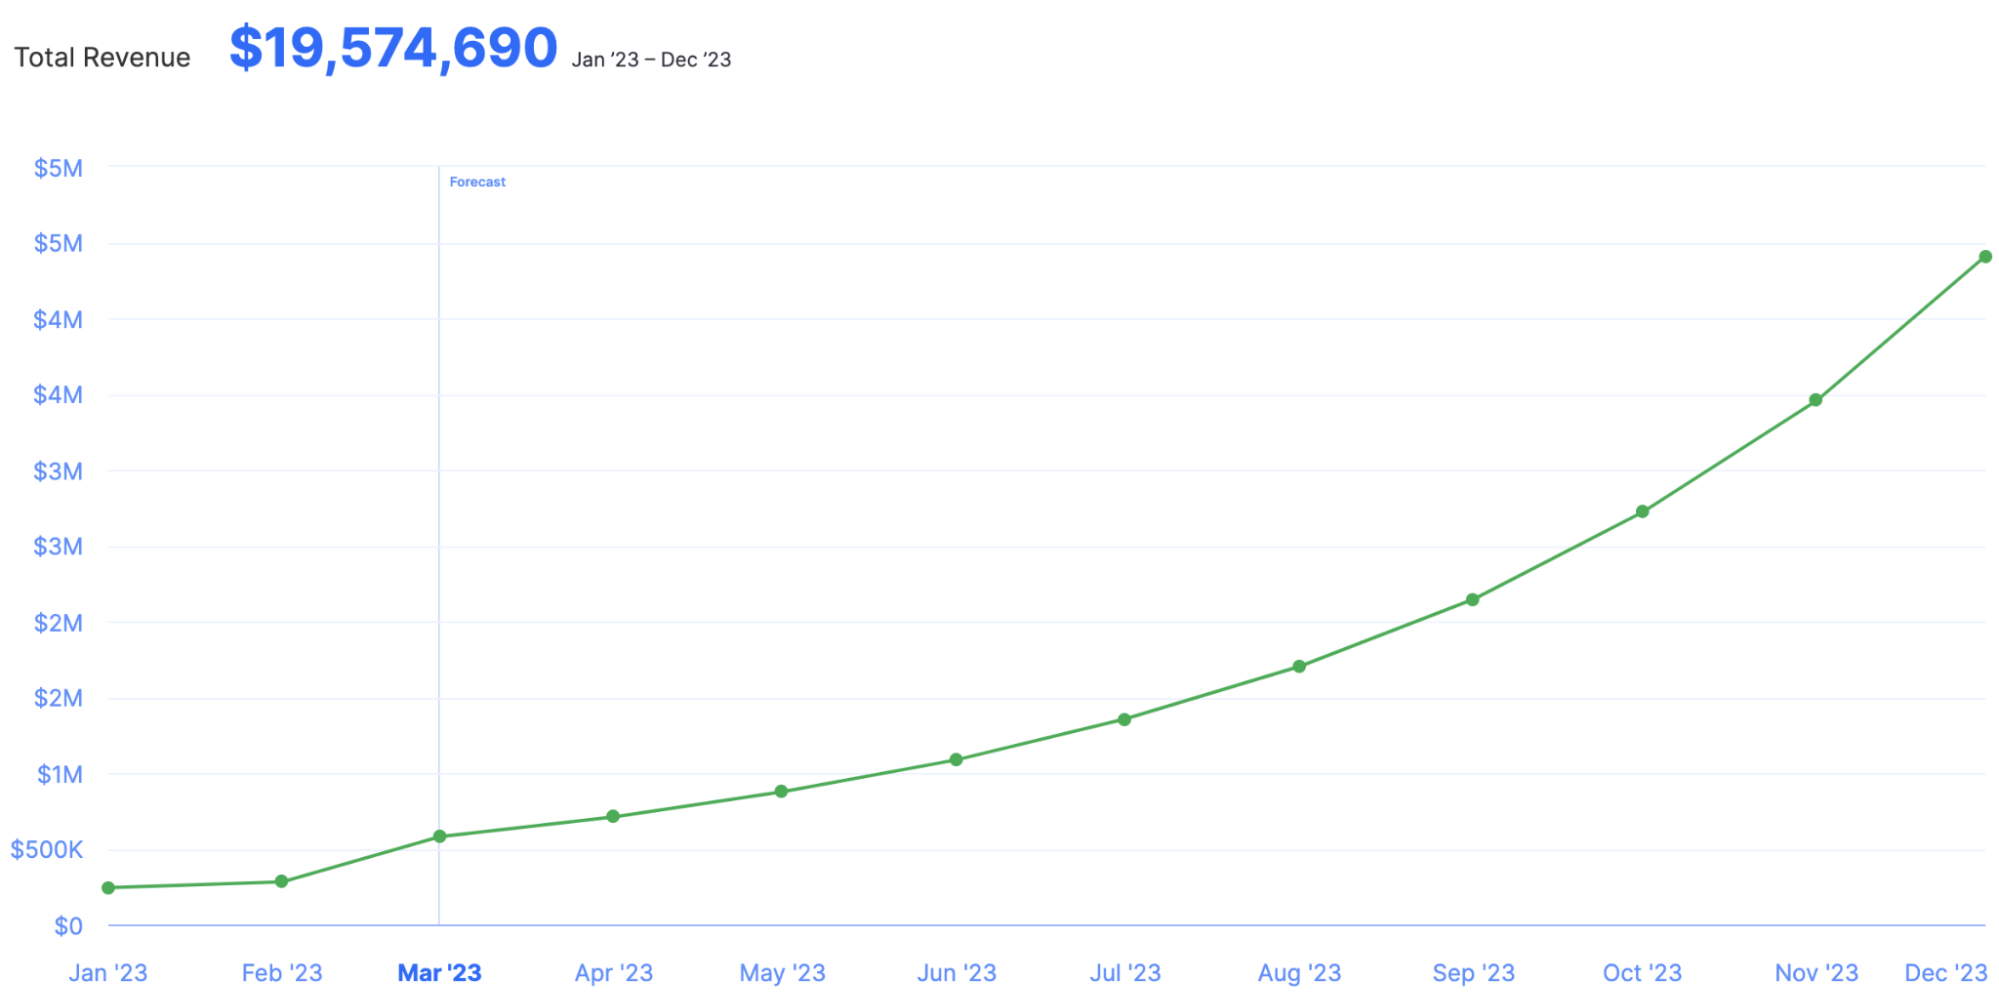
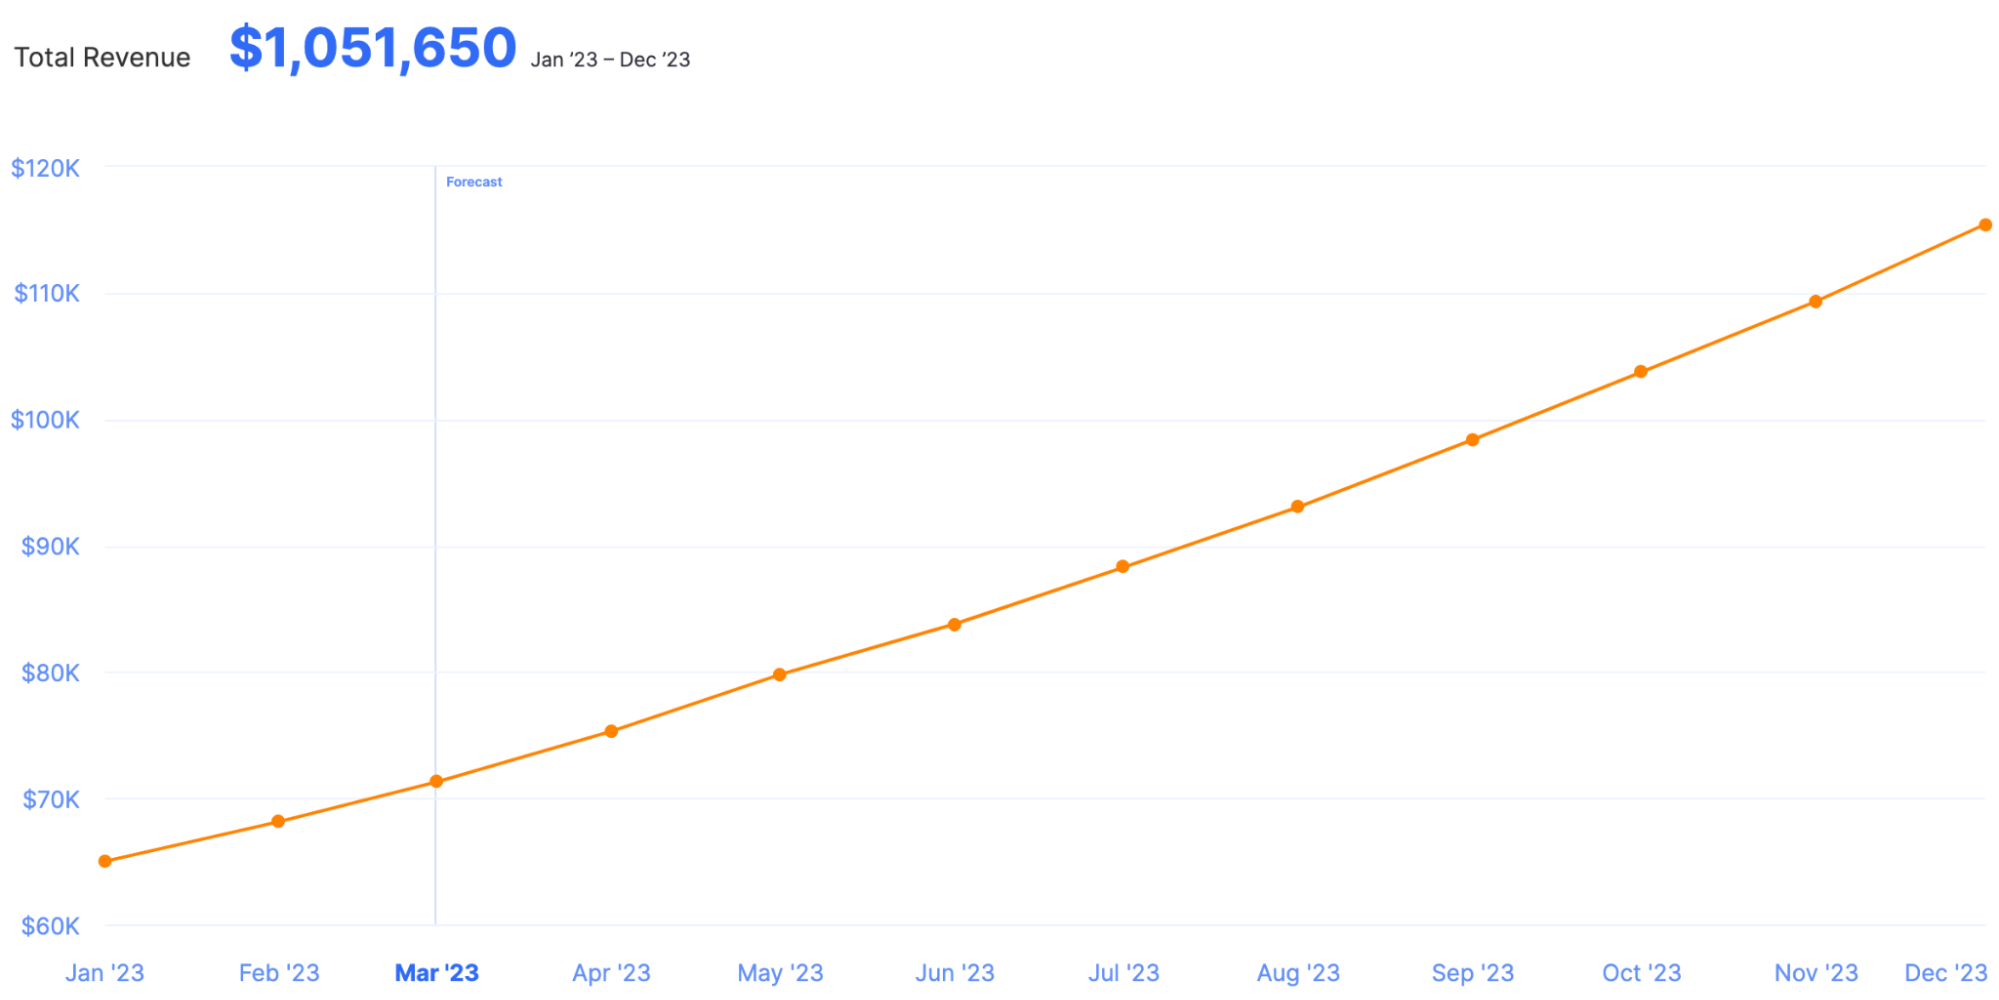
And here’s what our total revenue forecast looks like after adding in our forecasted template sales.

Boom! Just like that, we have a complete revenue forecast for our company. You can follow the same steps to forecast your revenue for your business.
The process will be different if you’re using a spreadsheet or another revenue forecasting tool, but the same general concepts apply:
- Add your products
- Add your revenue streams
- Make your assumptions for how much you’ll grow
If you want to build your forecast quickly and easily like in our example, I highly recommend using Finmark.
Bonus: Analyze Your Revenue Forecast
Creating a revenue forecast is great, but turning that data into actionable insights gives you even more value.
Here are a few of my favorite ways to analyze revenue forecasts in Finmark.
Analyze Your Percentage of Forecasted Revenue By Product
Finmark shows you a high-level chart of your revenue by product.
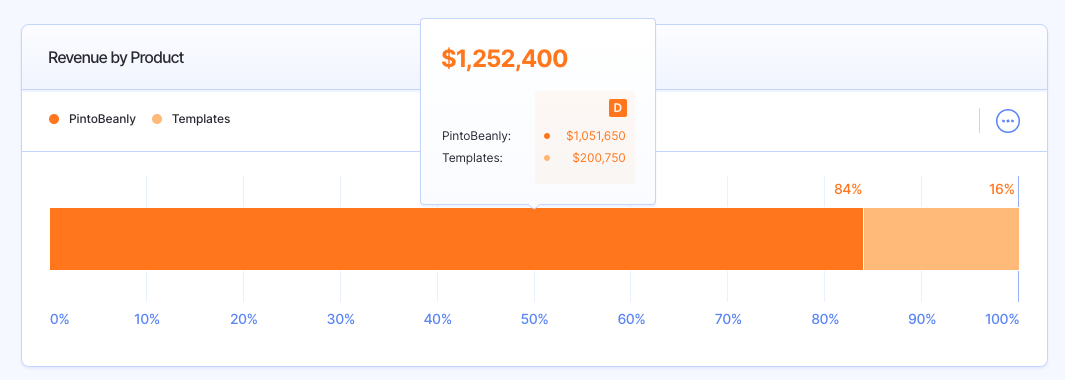
An example of a takeaway we might have from the chart above is our company is heavily reliant on the “PintoBeany” subscription. If that revenue dips, our template sales won’t be able to make up for the losses.
This imaginary company only has two products. But if you have multiple products, this chart becomes even more valuable.
You can quickly see which products are leading your revenue growth and dive deeper when needed.
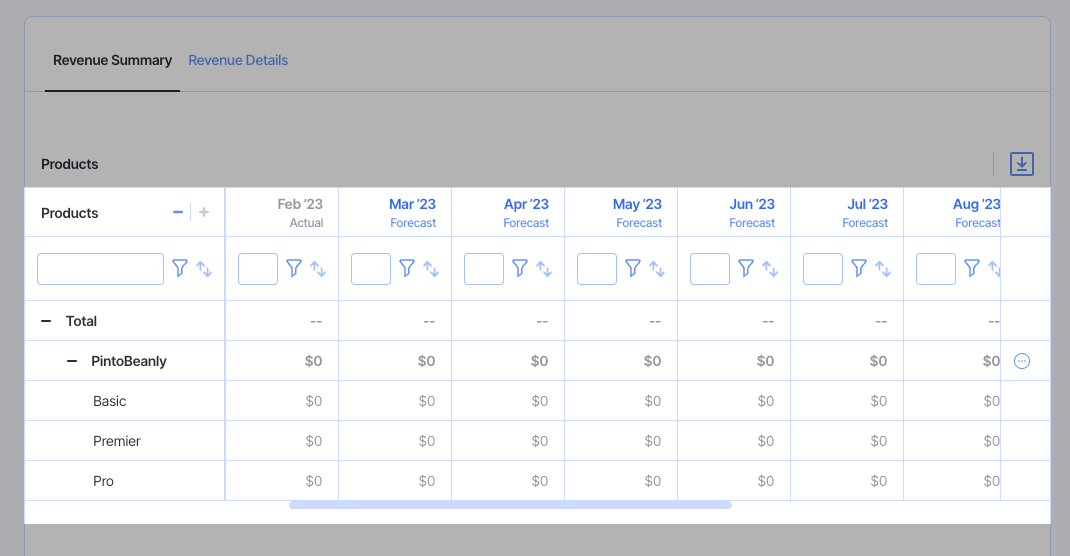
Analyze Your Revenue Forecast By Product
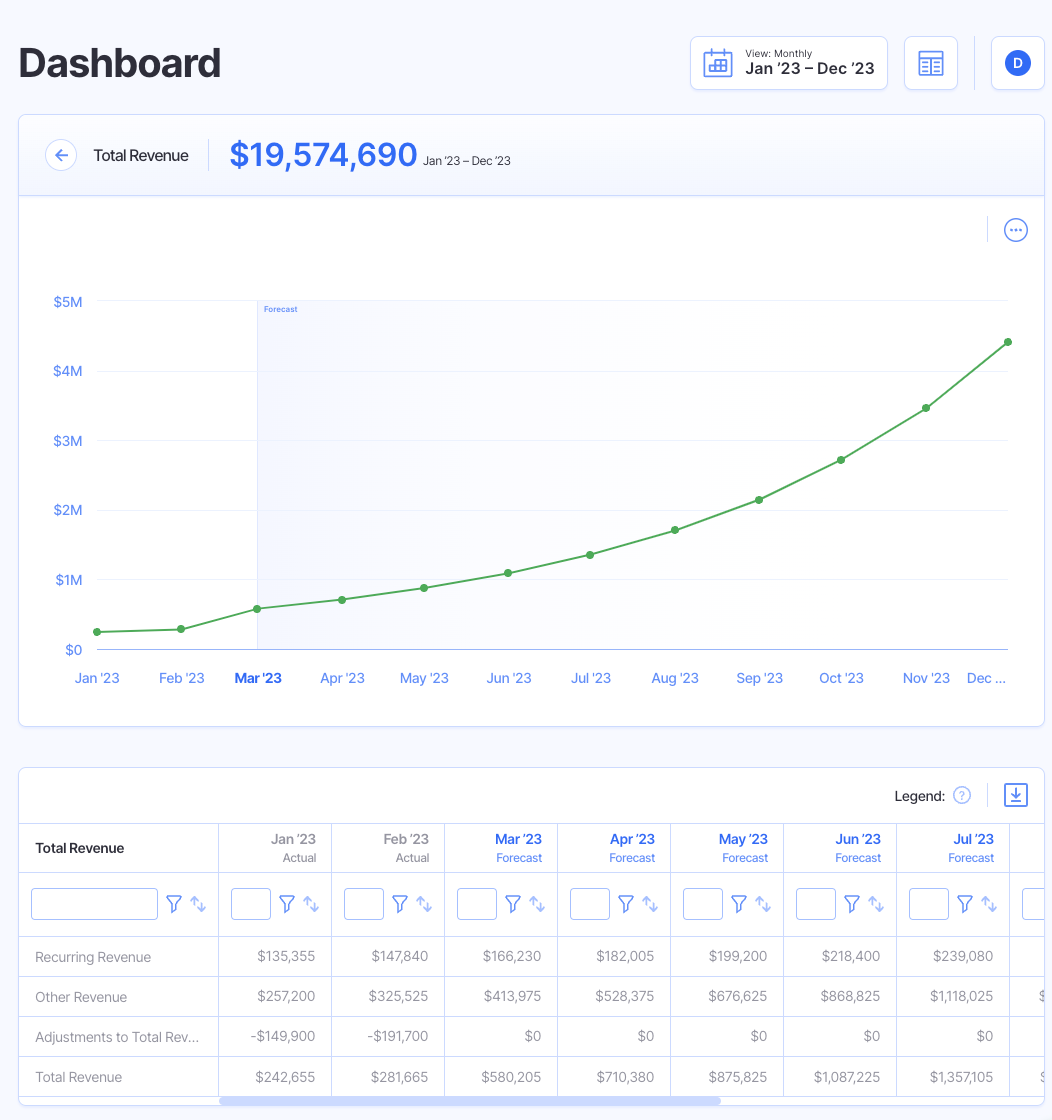
The next report I recommend using is your forecasted revenue broken down by product.
This table shows the forecasted (and actual) revenue for each product month-over-month.
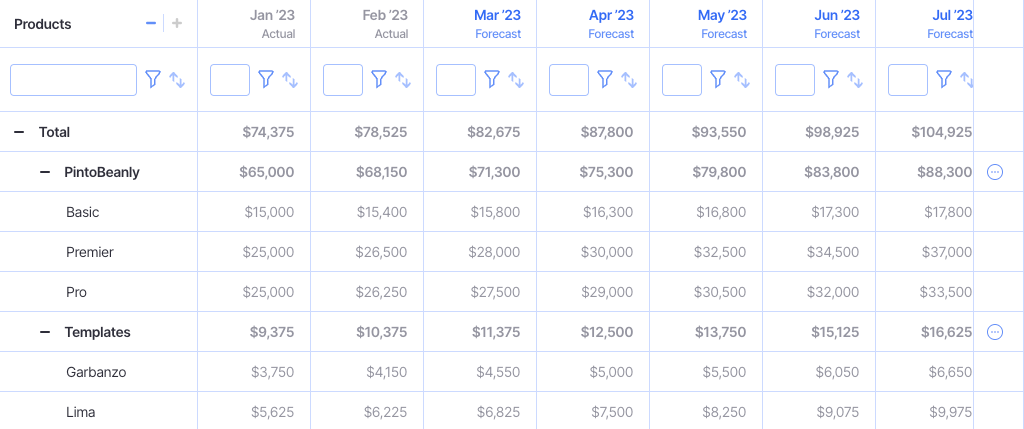
Seeing exactly how much revenue you’re forecasting for each individual product can be helpful in planning marketing and sales strategies, as well as overall growth planning.
If we decided to invest more into template sales to make the business less reliant on subscription revenue, we can use our current forecast as a baseline.
Then, we can create an alternative scenario that shows how our forecast might change if we ran online ads to promote the templates.
Check out our scenario analysis guide to learn more about that process.
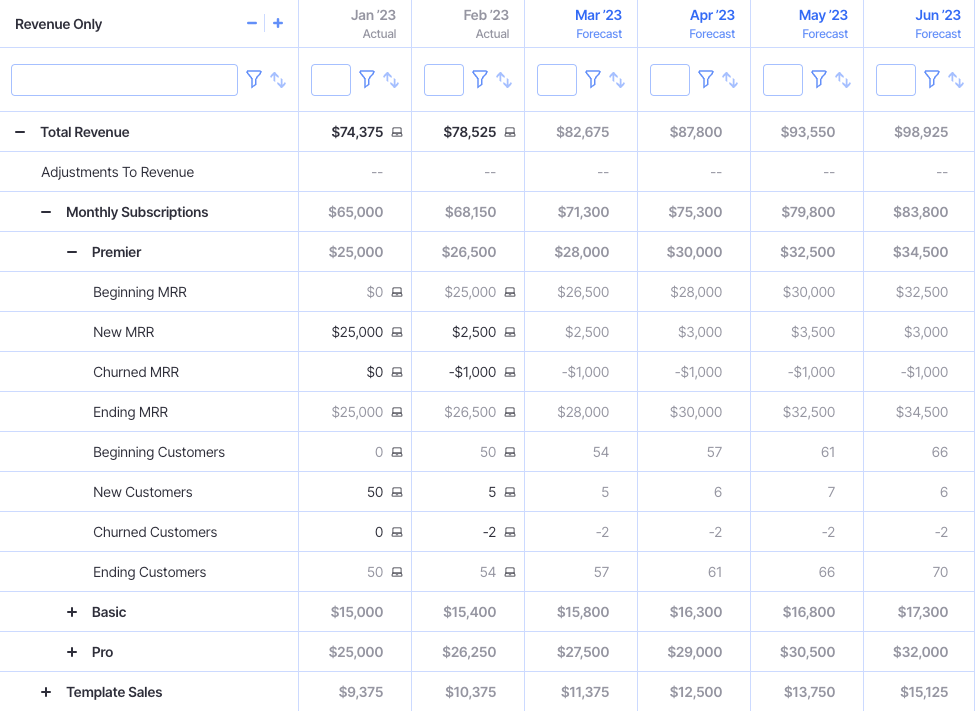
Analyze Forecasted Churn and Growth By Product
If you want to do an even deeper analysis of your revenue forecast, you’ll love our Revenue Details report.
This table is similar to the one above, but it breaks down your revenue even further by:
- Beginning MRR
- New MRR
- Churned MRR
- Ending MRR
It also shows how your customer count will change over time by product and subscription plan.
The level of analysis this allows you to do is incredible.
From spotting potential red flags in churn to planning new hires (how many customer support reps will you need based on your forecasted customer growth?) this report gives you plenty of data to work with.
If you’re interested in analyzing your revenue forecast on this level, sign up for a free trial of Finmark here.
Revenue Forecasting Tips & Best Practices
Now that you know how to create a revenue forecast, let’s go over some best practices to make sure your forecast is as useful as possible.
Here are some do’s and don’ts of revenue forecasting.
Base Your Assumptions Off Data
You’ve probably noticed a recurring theme throughout this article—data!
According to Meredith Fennessy, founder and fractional CFO at Le Chéile, “Your revenue forecast is only as accurate as the data you put into it.”
She says that although gathering data may take time, “it is important to ensure it is reliable, so you are confident in making data-backed decisions based on it.”
Making decisions based on an inaccurate forecast can cause devastating damage to your business.
For instance, say you forecast $1M of ARR in 12 months based on inaccurate sales data.
You build your hiring plan with the assumption you’ll reach $1M in ARR. However, it turns out your ARR is only $600K after 12 months because your sales forecast didn’t account for enough ramp time for new sales reps.
If you made new hires and ramped up expenses based on your original $1M forecast, your business will be in a difficult position and you’ll have to make some tough decisions to get back on track.
Long story short, data is your friend!
Don’t Try to Create the “Perfect” Forecast
The perfect forecast doesn’t exist.
Even if you go through every detail with a fine tooth comb, it’s impossible to predict exactly how much revenue you’ll have in three months, yet alone 1-2 years from now.
Between today and three months from now, any number of things can happen.
A new competitor could pop up and disrupt your entire industry. You could see a spike in customers after your product goes viral. Your growth could stay flat for an extended period of time.
The point is, business is dynamic.
Revenue forecasts aren’t meant to be crystal balls that predict your exact future. They’re meant to give you guidance so you can make more informed decisions.
Spending days or weeks trying to forecast every penny you’ll generate next quarter isn’t the best use of your time. Instead, try to get your forecast as accurate as you can, and make adjustments as things change.
Which brings me to my next point…
Update Your Forecast Regularly
Your revenue forecast shouldn’t be something you make at the beginning of the year and leave sitting to collect dust.
As things change in your business, you should update your revenue forecast to reflect the changes.
Jay Jung shared a story with us that explains why updating your forecast is so important.
He once created a forecast for an e-commerce consumer goods company. The forecast was “based on historical trends such as return-on-as-spend (ROAS).”
However, when Apple changed its privacy policies in 2021, “it drastically impacted the company’s ability to effectively administer direct-response ads.”
As a result, the company’s ROAS plummeted, which threw off their previous revenue forecast.
Jung notes, “Even for well-oiled machines, there are always exogenous factors that can significantly impact your business drivers.”
In his case it was Apple’s policy change. But it could also be supply chain disruptions, consumer trends, or other factors within or outside of your control.
To account for these shifts, Jung emphasized the importance of analyzing budget vs. actuals “not just on the P&L statement but also the underlying drivers such as ROAS or Sales Quota Attainment etc. to ensure you are on track with your goals.”
He suggested a quarterly rolling forecast to manage your business in a more agile fashion.
Don’t Create Your Forecast Alone
You don’t have to build your revenue forecast on an island.
In fact, Kimberly Loftis (CFO and current president of Loftis Consulting) says collaboration is vital for accurate forecasting.
According to Lofitis, “The number of departments that impact revenue can differ based on type of business but, at a minimum, both sales and operations should be part of the process.”
Collaboration allows the person driving the forecast to “understand the challenges and opportunities of these departments to forecast accurately,” says Lofitis.
As for the best way to facilitate collaboration, she suggests monthly meetings with department partners to keep abreast of any changes occurring that could impact revenue.
Shameless plug: Our financial planning software makes collaborating on your revenue forecast much easier with shared dashboards, commenting, annotations, and more!

Use Your Forecast to Plan Your Growth Strategy
As I mentioned earlier, your revenue forecast is more than just a report for viewing. You can (and should) use it to plan your growth strategy.
Remember, your forecast shows you where your company is based on your current plan. But what if you want to grow revenue faster? Or maybe you want to measure the impact certain activities will have on revenue growth.
By creating multiple scenarios, you can test plans before putting them into action and see how they’ll affect your revenue growth.
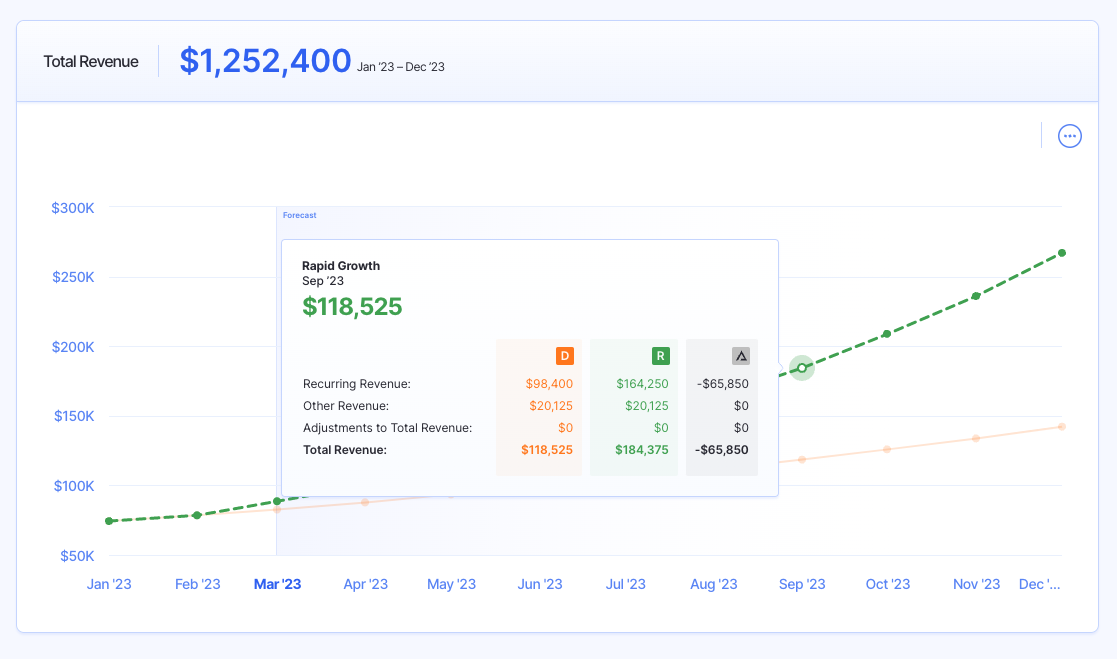
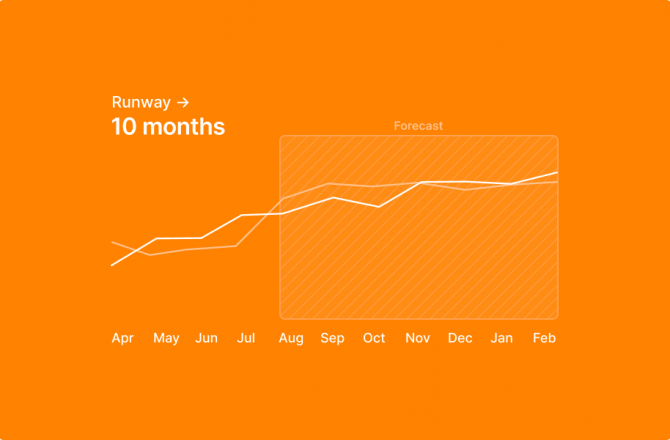
For example, in the screenshot above, we’re looking at a revenue forecast based on two different scenarios:
- Green: This scenario assumes this company will convert more leads
- Orange: This scenario assumes the company will convert an average number of leads
This data can help set goals for what their target conversion rate needs to be in order to meet their revenue goals.
If you want to learn more about how to create, compare, and analyze multiple growth scenarios check out our scenario analysis guide.
Don’t Be Too Conservative (Or Too Aggressive)
When you’re building your revenue forecast, consider whether you’re being too conservative or aggressive with your assumptions.
An overly-aggressive revenue forecast can lead to spending money you don’t have. It also hurts morale when you’re constantly falling short of your forecast.
Believe it or not, an overly-conservative forecast also isn’t great.
If your revenue grows faster than you anticipated, you could find yourself understaffed and/or overworked.
On top of that, if you’re consistently under-forecasting your revenue, you might not be growing as fast as you could.
Here’s why.
Let’s say you forecasted you’d do $1M in annual revenue; but you end up doing $1.5M.
If your forecast would’ve been more accurate, you could’ve planned to hire more people or invested more into marketing campaigns throughout the year, which in turn could’ve boosted your revenue even more.
This is why we always recommend using data as much as possible for your forecast—it’ll give you guidance for your assumptions.
If you know your monthly lead volume, lead conversion rate, marketing spend, and other variables, you’ll be able to build a much more reliable forecast than if you’re just winging it.
There’s nothing wrong with setting aggressive goals for revenue growth, or wanting to prepare for slower or declining revenue, but try to be realistic.
Following the steps we laid out in this guide will help a lot. But it’s also helpful to self-regulate so you know when your forecast seems “off”.
Ready to Build Your Revenue Forecast?
Revenue forecasting doesn’t have to be overly-complicated or so complex that only financial pros can do it.
If you have the right tools and understand how and why your business grows, you can build a revenue forecast that’ll help you project growth, present to investors, and make informed decisions about where to take your company.
And if you want the easiest way to forecast revenue, I highly recommend giving Finmark a try. Not only can you forecast revenue, but you can also create your entire financial plan for your business. Did I mention you can try for free?
This content is presented “as is,” and is not intended to provide tax, legal or financial advice. Please consult your advisor with any questions.