How to Do Scenario Analysis: Step-By-Step Guide

Ask 10 founders how they grew their business and you’ll probably get 10 different answers. There is no one-size-fits-all path to growing a startup, and there’s a long list of factors that’ll impact the ups and downs of your business.
That’s why scenario analysis can be one of the most useful tools at your disposal—if you know how to do it.
Taking the time to prepare for the good, the bad, and the ugly will put you in a much better position to capitalize on the highs and work your way out of the lows. And you don’t have to be a financial analyst to do it.
I’ll show you what scenario analysis is, why it’s important for your financial model, and I’ll walk you through an example, step-by-step.
Let’s get to it!
What Are Scenarios?
Running a business involves a certain level of risk and unpredictability. Sure, in an ideal world your company would be able to grow without a hitch. But as most founders will tell you, that’s rarely ever the case.
Scenarios are the possible outcomes of your business based on different variables and assumptions.
For instance, one scenario could be your business experiencing hockey stick growth because your new user adoption is through the roof and your product goes viral.
Or maybe your revenue growth is stagnant because you aren’t able to acquire as many new customers as you anticipated.
One of the most important things to keep in mind is that scenarios should be based on real-life circumstances, not your worst fear or pie in the sky goals. A scenario based on the assumption that Elon Musk is going to Tweet about your cryptocurrency software probably isn’t realistic.
But an assumption that your revenue will grow because market data suggests cryptocurrency is trending upwards, is closer to reality.
Building a business without planning for the ups and downs is like using a GPS that only gives you one route! Click To TweetWhat is Scenario Analysis?
Scenario analysis, or what-if-analysis, is the process of building, testing, and analyzing different scenarios for your business. You’ll do this using your financial model.
Generally speaking, companies have at least three scenarios in their model:
- Base scenario: What happens to your business if you stay on your current growth trajectory, and there are no major changes.
- Upside scenario (a.k.a. “best case scenario”): What happens to your business if things go better than planned.
- Downside scenario (a.k.a. “worst case scenario”): What happens to your business if things go worse than planned.
During your analysis, you’ll ask and answer questions like:
- What does our base scenario look like?
- What do we need to do to make our upside scenario happen, and how will it impact our business?
- If our downside scenario happens, how will our business sustain?
A lot of founders and analysts do scenario analysis in Excel, but thanks to tools like Finmark from BILL, you can use software to create and analyze scenarios quicker. We’ll dive into how to do this in a bit.
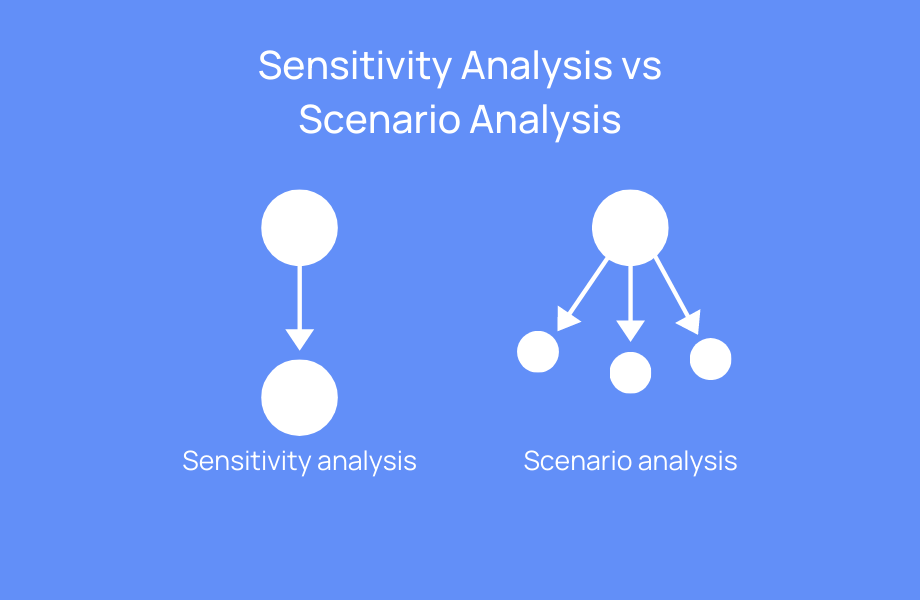
Sensitivity Analysis vs. Scenario Analysis
One thing to note, scenario analysis is not the same as sensitivity analysis!
While the two terms get used interchangeably sometimes, and are somewhat similar, they’re not the same thing.
Sensitivity analysis is the process of analyzing individual variables/decisions to see how they impact an aspect of your business—one at a time. You’re testing one input/variable and measuring how it impacts your output.
For instance, if you increase your prices by 10%, how will it affect your revenue? Or if you give everyone in your company a 2% raise, how will it impact your burn rate?
Scenario analysis on the other hand, is when you analyze what happens when you make a decision that impacts multiple variables. For example, what happens if you don’t release a specific feature set in time? Or what happens if a marketing channel outperforms expectations?
Sensitivity analysis and scenario analysis both play an important part in forecasting and building your financial model, but they are not the same thing.
Why Scenario Analysis is Important For Your Business
Scenario analysis is one of the most important things you can do when you’re building your financial model. Here’s why.
Plan Ahead
The most obvious advantage of scenario analysis is that it allows you to plan ahead.
Whether you’re doing financial planning, building your growth strategy, or getting ready to present to investors, having a plan in place for whatever direction your company goes in will put you in a much better position to pivot and adjust when major events happen.
For example, when you create your downside scenario, you might project lower revenue numbers, which will impact your cash runway. But since you’ve planned it out, you’ll know what adjustments you need to make in order to sustain through down periods and course correct.
The same thing applies to your upside scenario. If you plan for your business to overperform, you can be strategic about how to invest the extra revenue to fuel your growth.
Build A More Realistic Financial Model
Founders are optimistic by nature. That’s a great trait for motivating your team and keeping your eyes on the future. However, it can cloud your judgment when you’re doing financial modeling.
A financial model isn’t supposed to just be aspirational. It’s a tool to help you project what the financial future of your business will look like based on assumptions. Those assumptions shouldn’t always be positive.
If your business only has three months of runway, you need to know about it and make plans for what to do.
I’m not saying you shouldn’t have an optimistic view. But you shouldn’t only build your model based on positive assumptions.
Scenario analysis forces you to consider all the different routes your business might take—good or bad—so that you can plan accordingly. Click To TweetTest (And Compare) Your Financial Assumptions
Scenarios are based on assumptions you make about your business, industry, and overall market volatility. Scenario analysis gives you the opportunity to test your assumptions before putting them into action.
For instance, you might feel very optimistic about a new set of features you’re going to release next quarter. It’s a set of features none of your competitors have, and people have been requesting for months.
When you’re creating your scenarios, you can test your assumption that you’ll see a big increase in new revenue from leads who’ve been awaiting these features. But you can also test the assumption of what’ll happen if the features don’t draw in as many customers as you hoped for.
Being able to analyze these assumptions beforehand allows you to make decisions based on data rather than just your gut.
How to Perform Scenario Analysis
Now that you know the what and why, let’s take a look at a scenario analysis example. I’ll walk you through a quick overview of how to create multiple scenarios and analyze the findings.
I’m going to be using Finmark in this example, but I’ll also show you how to do scenario analysis in Excel (spoiler alert: it’s MUCH easier to do it in Finmark). I’m also going to assume you have a base scenario (i.e. your live financial model) setup.
The Premise
For this example, we’re going to pretend we’re building a financial model for a SaaS startup that makes CRM software.
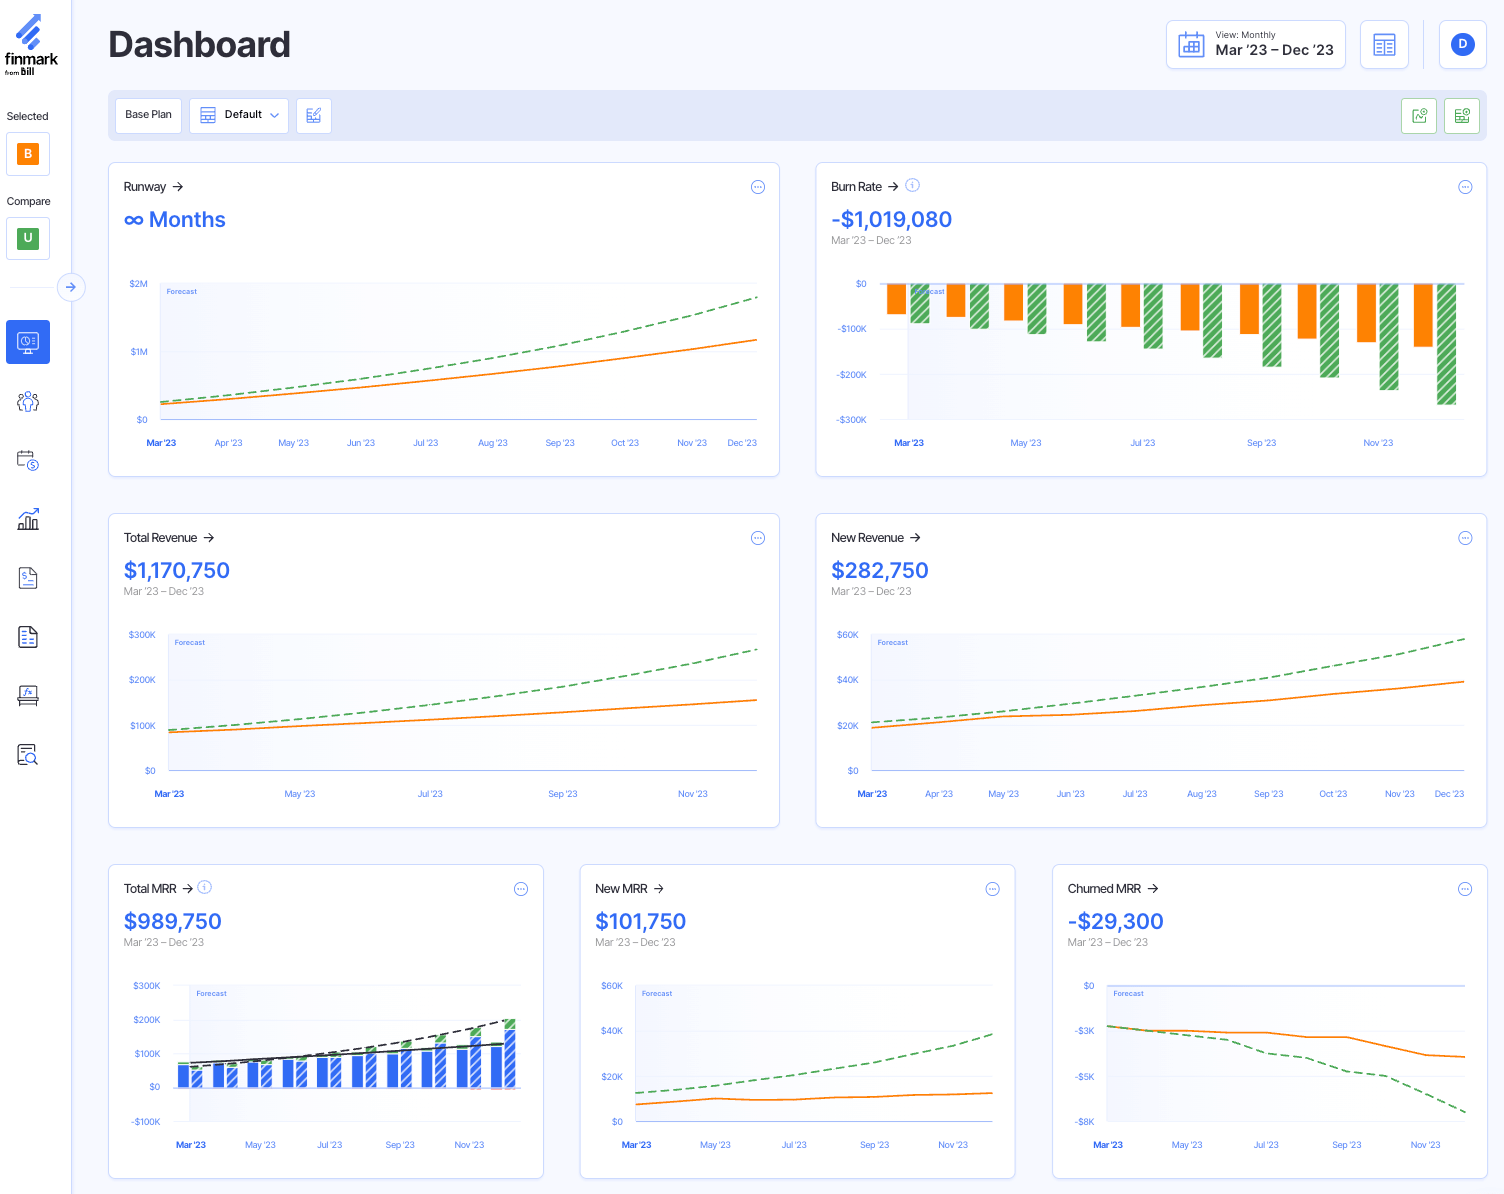
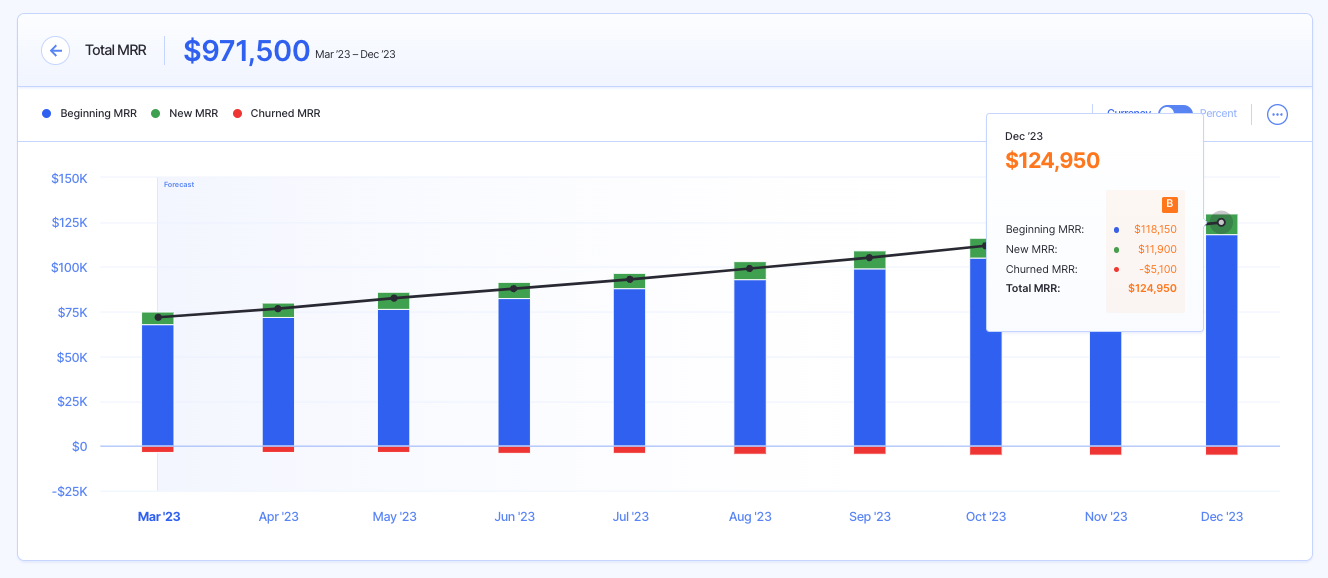
So far our growth has been steady, but we want to speed things up. At our current rate, our forecast says we’ll reach ~$125K monthly recurring revenue (MRR) by the end of the year.
However, we’d like to reach at least $200K MRR this year, with the goal of doing a round of fundraising next year.
Our plan is to invest in a paid search campaign to drive additional revenue and hit our new revenue goal.
Before we start spending money, we can do scenario analysis to forecast the impact the campaign will have on our growth and test our assumptions.
Here’s the process.
1. Make The Assumptions For Your Scenarios
Scenarios are based on assumptions. So the first step is to identify what your assumptions are.
For our example, our assumptions are going to be based on how our marketing campaign performs. Specifically, how many leads and revenue they drive.
We’ll have four scenarios:
- Base scenario: This is our live model, where we don’t do the marketing campaign at all.
- Upside scenario: If our competitors don’t outbid us for our target keywords, our landing pages convert well, and the leads convert into customers, this is our best case scenario. This scenario will have a lower cost per lead (CPL) and a higher lead conversion rate.
- Average scenario: If we run into a little competition with our ads, our landing pages convert moderately well, and we can convert a decent amount of leads into customers, we should get a moderate performance. This scenario will have an average CPL and lead conversion rate.
- Downside scenario: If multiple competitors are bidding on our target keywords, we generate fewer leads, and have fewer opportunities to convert them into customers, we’ll have a less than average performance. We’ll assume a higher CPL and a lower conversion rate in this scenario.
2. Add Your Scenarios to Your Financial Model
It’s extremely simple to add multiple scenarios in Finmark. All we need to do is duplicate our base scenario.
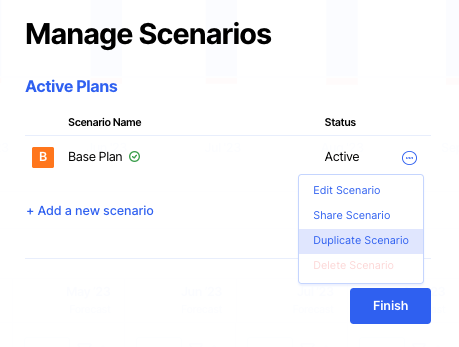
This will create an exact duplicate of our original scenario, complete with all of our revenue, churn, and other data. No need to copy/paste!
We’ll start with our Average scenario, and include a note so we know what assumptions were made on this scenario.
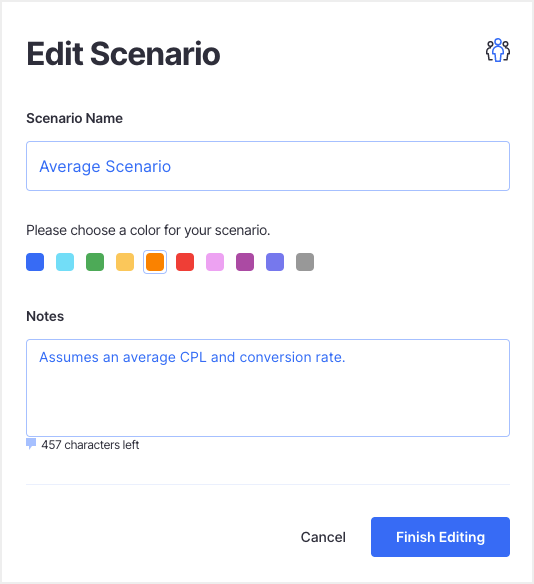
We’ll repeat that process for the other scenarios as well.
3. Fill in The Data For Your New Scenarios
Now that we have our new scenarios, we simply need to fill in the data. Depending on what your assumptions are for each scenario, you can change any number of things. For instance, you might assume a lower customer growth rate, or a higher churn rate.
For our example, we’re going to add our ad campaign details. Check out our Revenue Drivers article for a step-by-step guide on how to do that.
As I mentioned, the only thing we’re going to change for each scenario are the CPL and lead conversion rates.
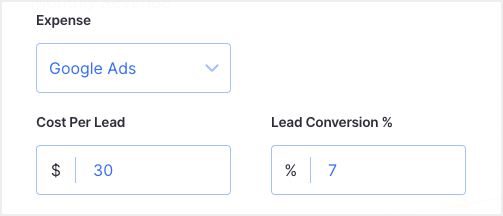
Here are the assumptions we’re going to make for each scenario (these numbers are based on industry benchmarks and averages):
| Scenario | CPL | Conversion Rate |
| Average | $30 | 7% |
| Upside | $15 | 12% |
| Downside | $60 | 3% |
Once we fill in all of this data, we have all of our scenarios ready!
4. Compare & Analyze Your Scenarios
The last step is where we’ll compare and analyze our scenarios.
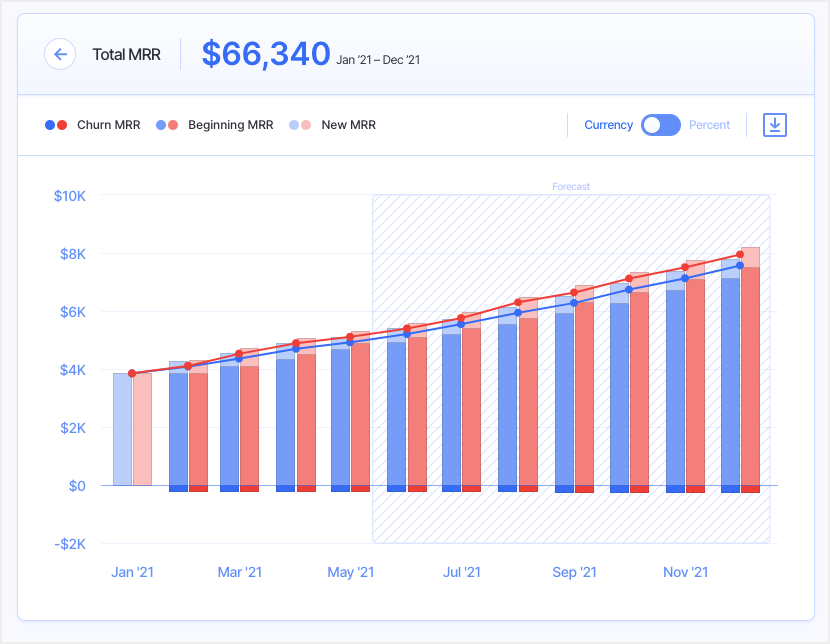
In Fimark, we can compare all of our metrics across our scenarios. For instance, if we want to know which scenario(s) will allow us to reach our $10K MRR goal, we’ll start by comparing the Average and Upside scenarios.
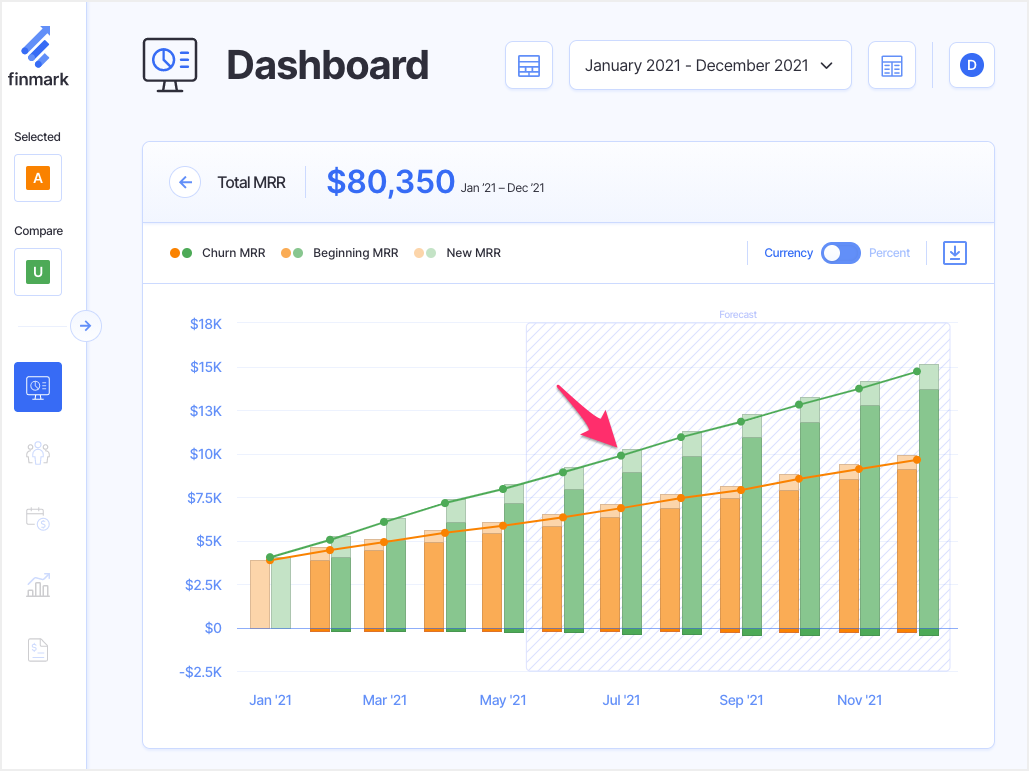
Here, we can see the Upside scenario (green) hits $10K MRR by August. With the Average scenario (orange) we’ll land right under $10K MRR by December.
Based on that, we know that if we’re able to get our CPL between $15-$30, and convert at least 7% of our leads into customers, we should be able to reach $10K MRR by the end of the year.
Next, let’s see what happens with our Downside scenario. We’ll compare our Downside scenario (red) against our Average scenario (orange).
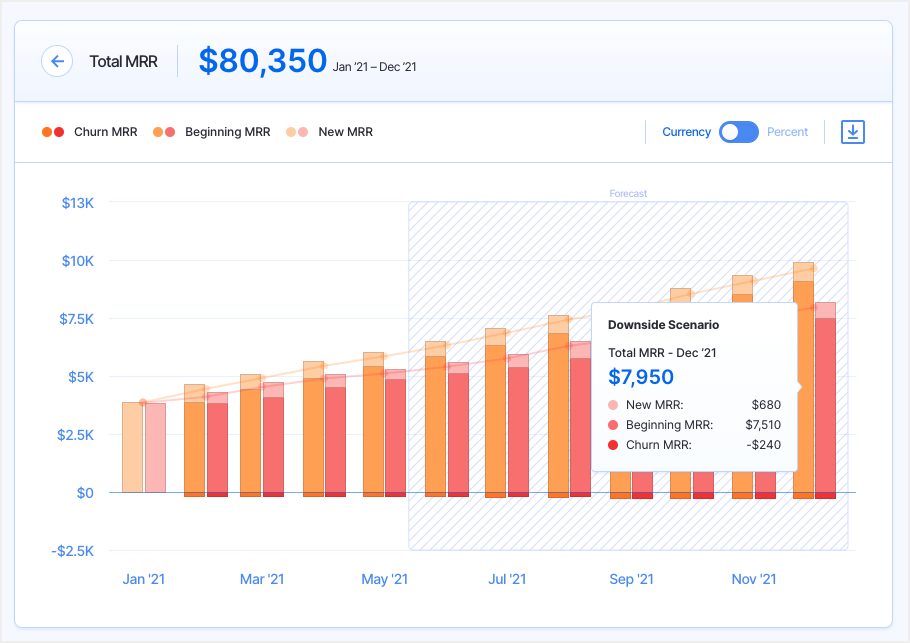
Here, we can see our MRR maxes out below $8K in our Downside scenario by the end of the year.
When you compare that to our Base scenario (the one where we don’t run ads at all), it looks like underperforming might be worse than not running the ads at all.
We’re only generating slightly more MRR (a few hundred dollars).
On top of that, since the ads aren’t performing, it negatively impacts our runway since we’re spending money on ads that aren’t generating the ROI we need.
In the screenshot below, you can see our projected cash runway is much stronger in our base scenario (blue) than the downside scenario (red).
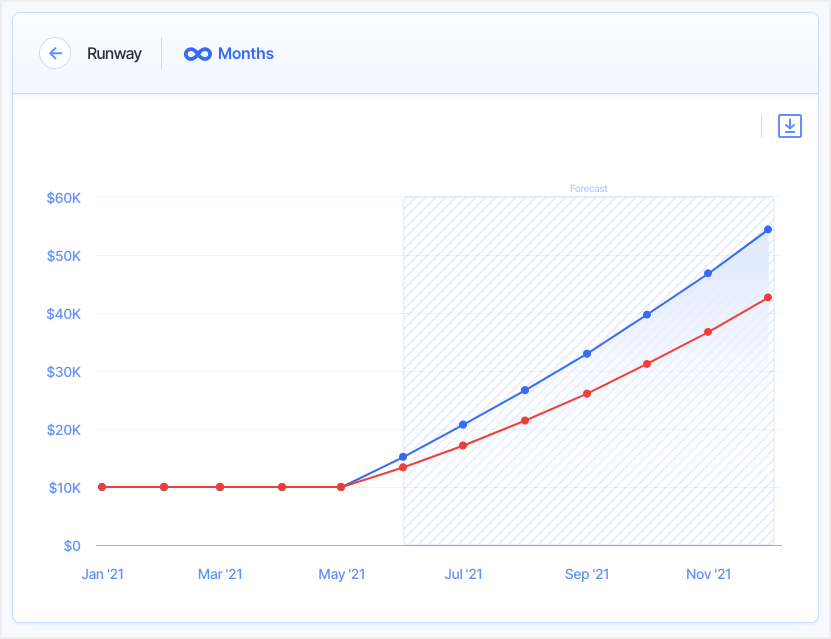
Based on this, if we’re six months into the campaign and notice our CPL is around $60 and only converting 3% of our leads, we could consider ending the campaign and putting the money towards another channel that might get us better results.
From this quick exercise, we were able to identify some key things like:
- What our goal CPL and lead conversion rate should be
- When we need to cut off this campaign because it’s negatively impacting the business
- How quickly we can reach our target MRR
This info will help us make decisions about where to spend our money and figure out the best path for growth.
And this is just one example. You can use scenario analysis for marketing campaigns, measuring the impact of seasonality, the effect of new competitors entering your market, rising cost of goods, new tax rates, and more.
Scenario analysis is a wildly helpful tool for making decisions and planning growth.
Scenario Analysis in Excel
Now that you’ve seen an example of how to do scenario analysis in Finmark, I thought it might be worth showing you what the process looks like in Excel.
I’ll warn you in advance—the process is much more complicated and involves more manual work, formulas, and copying/pasting.
Rather than write out a step-by-step guide, I’ll leave you with this video of a scenario analysis example in Excel. I have a feeling you’ll quickly understand why I suggest using Finmark instead 😉
Ready to Give Scenario Analysis a Try?
There you have it. A step-by-step guide on how to do scenario analysis!
If you’re ready to give it a try, you can sign up for a free trial of Finmark today. Not only can you create and compare multiple scenarios, but you can build your complete financial model, measure all your important KPIs, and forecast your company’s growth.
This content is presented “as is,” and is not intended to provide tax, legal or financial advice. Please consult your advisor with any questions.