Introducing Finmark 2.0!

It has been over 12 months since we released version 1.0 of Finmark to the world. Since that time, we’ve made several major updates including new integrations and formulas and variables.
On top of that, we’ve talked to countless founders, finance experts, and investors to learn more about what they want from a financial planning tool, and used those conversations to continuously evolve our product.
All of that has gotten us to where we are today, and we’re excited to announce the release of Finmark 2.0!
What Does This Mean For You?
Don’t worry, we didn’t completely change the look of our product and add a bunch of useless features.
You can still expect the clean design and easy-to-use interface our community knows and loves. However, you now have more control, flexibility, and customization options than ever before!
What Changed?
Here’s a look at some of the major updates you’ll see when you log in to your Finmark account (or when you sign up for the first time).
More Control Over Employee Expenses

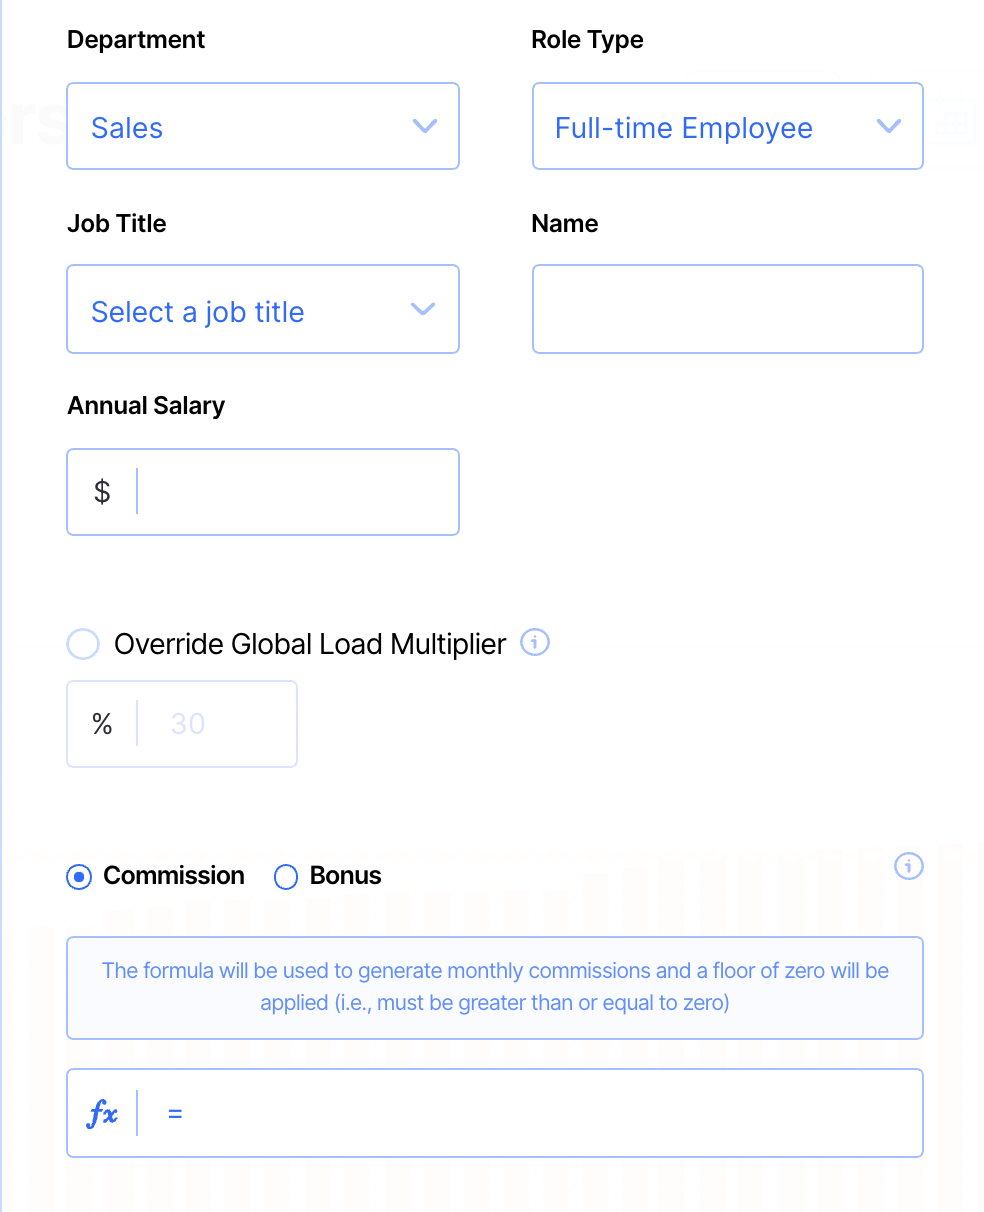
- Forecast employee bonuses and commissions: Do you offer employee bonuses or commissions? You can now use custom formulas and variables to forecast those expenses. (learn more)
- Forecast non-annual salaries: Not every employee will have an annual salary. With our latest updates, you can forecast all types of employee pay schemes, not just annual salaries. That means if you have contractors, or pay employees hourly or monthly, you can now forecast those expenses in Finmark using custom formulas!
More Accurate Revenue Forecasts

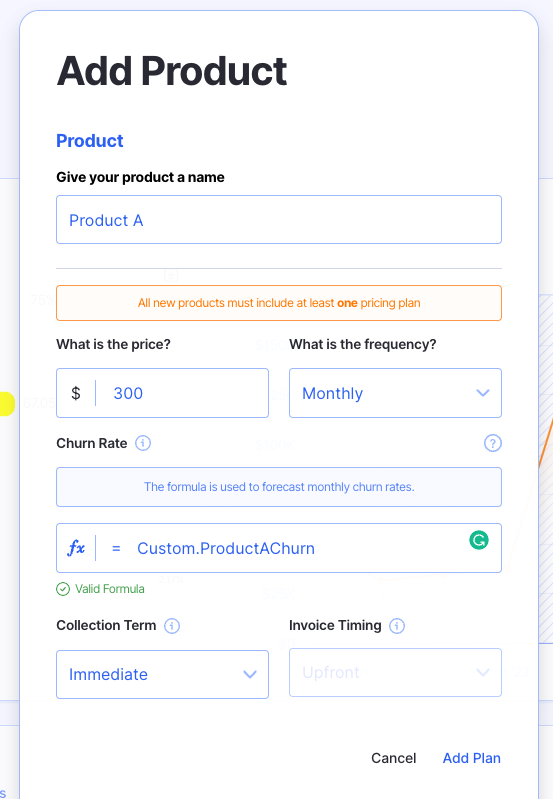
- Improve churn assumptions: Does your current model assume a flat churn rate over the next 12 months? You might have a 10% churn rate today, but as you improve your product, customer experience, and processes, you’ll likely lower that number. Now, you can use custom formulas to build your assumptions about churn into your model. (learn more)
- Forecast pricing assumptions: If your pricing changes over time due to seasonality or planned increases and decreases, you’ll be able to build those changes into your forecast for a more accurate model. This makes it easier to forecast the impact that short-term promotions, annual price increases, and other changes will have on your business before you implement changes.
More Dashboard Options

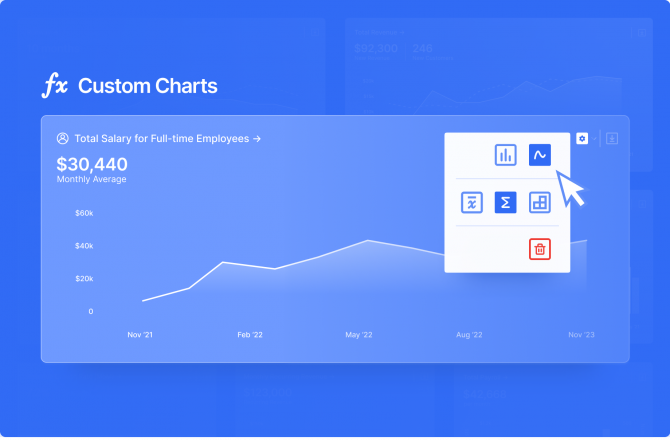
- Chart your own metrics: If there are certain metrics you want to track and forecast that we don’t already have in Finmark, you can add them as custom variables and view them on your dashboard! You can also create dashboard charts for all of our system-generated variables as well. (learn more)
- Customize your dashboard: In addition to adding custom variables to your dashboard, we’re also giving you more ways to view your charts. You can change the type of chart (bar vs. line) and how the value of the metric is calculated (average, sum, or month to date).
- Export the data: Want to add your custom charts into a presentation for investors or your board? You can export them as an image or CSV file to use in your pitch deck, investor emails, or elsewhere. (learn more)
More Integrations
- Wave and Zoho Books: In case you missed it, we added a couple of new accounting system integrations. You can now connect your Wave or Zoho Books account directly into Finmark!
Experience The New & Improved Finmark!
If you’re already a Finmark user, log in to your account and test out all these new features. We want to hear your feedback!
If you haven’t tried Finmark yet, or you used it in the past but decided it wasn’t the right time, I highly recommend starting a free trial to experience the latest version. You can also schedule a demo if you’d prefer a walkthrough from our team.
This content is presented “as is,” and is not intended to provide tax, legal or financial advice. Please consult your advisor with any questions.
