20 Startup Metrics to Keep a Pulse on Your Business

Scaling a startup to success relies on a lot of factors.
But, founders that understand the key growth levers and other crucial metrics that drive their business will have a straightforward way to monitor their progress. In turn, they can make quick decisions as needed to move the startup toward success.
No two startups are alike. So, each will have its own way of tracking the health and growth of its operations. But, the following metrics give you a good jumping-off point.
As you aim for long-term growth, make sure you develop a set of metrics to monitor based on your revenue model, goals, and other factors that can help you get there.
Here are 20 startup metrics your team should consider tracking to measure the health of your business from all angles.
Revenue Metrics for Startups
1. Monthly Recurring Revenue (MRR)
MRR, or Monthly Recurring Revenue, is the lifeblood of a SaaS startup. While the other startup metrics on this list are important, MRR is arguably the most important of all.
This metric represents the predictable revenue you earn from customers each month.
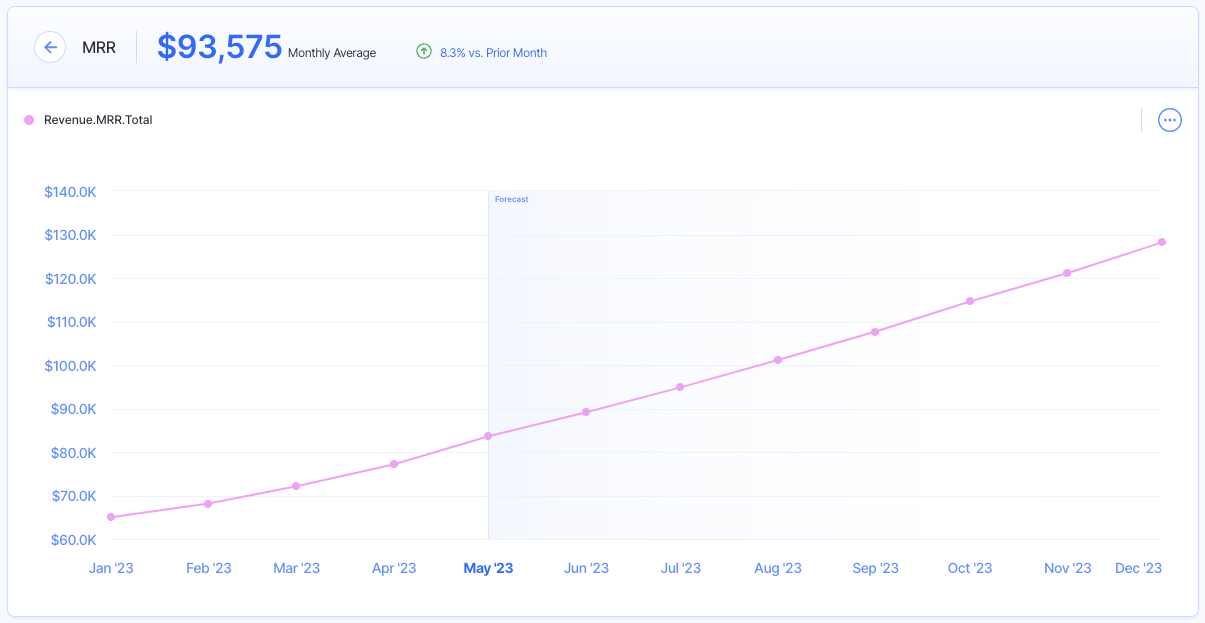
Because SaaS products work on a subscription basis, you can expect each customer to pay the same amount they did last month unless they cancel, upgrade, or downgrade their account.
MRR doesn’t take into account new revenue expected to come from new customers–just your existing ones. All you need to do to calculate your MRR is multiply the number of monthly customers you have by the average monthly revenue per customer:
Average Monthly Revenue per Customer * Total # of Customers
When calculating your MRR—or referring to a tool that does it for you, like Stripe—make sure you understand how the MRR is taken into account.
For example, some platforms may not consider coupon codes and discounts, while others do.
So why is MRR so crucial for SaaS startups to track? On top of predicting your revenue and financial forecasting, MRR helps you read the pulse of your startup to see how well—or how poorly—you are doing to build sustainable revenue growth.
Based on your MRR, you can monitor your growth rate, churn rate, and forecast future revenue using Finmark.
2. Burn Rate
Your burn rate is your monthly negative free cash flow.
Your gross burn rate, which is the total amount of cash spent on a monthly basis to keep your startup running, doesn’t take revenue into account.
On the flip side, your net burn rate does. Here’s how to calculate it:
Total Monthly Revenue – Gross Burn Rate
If your net burn rate is a positive number, it means your company’s expenses are greater than the revenue you’re bringing in. If the burn is a negative number, it means your revenue is outpacing your expenses, which is a great sign.
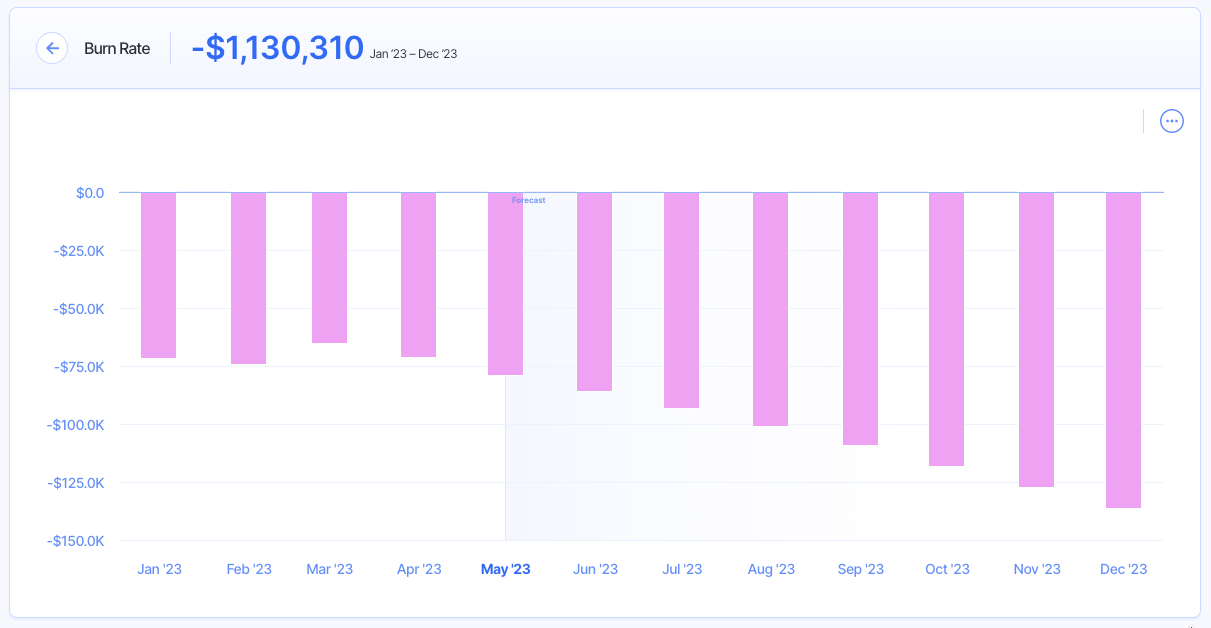
Tracking burn rate is essential to understand how long you can keep operations going and assess the sustainability of your overall business.
Since running out of cash is one of the top reasons startups fail, understanding your burn rate can help you proactively cut costs, use your cash more efficiently, and increase sales before it’s too late.
3. Cash Runway
If your burn rate is positive, your startup will eventually run out of cash.
Your cash runway calculates the number of months you have until that happens.
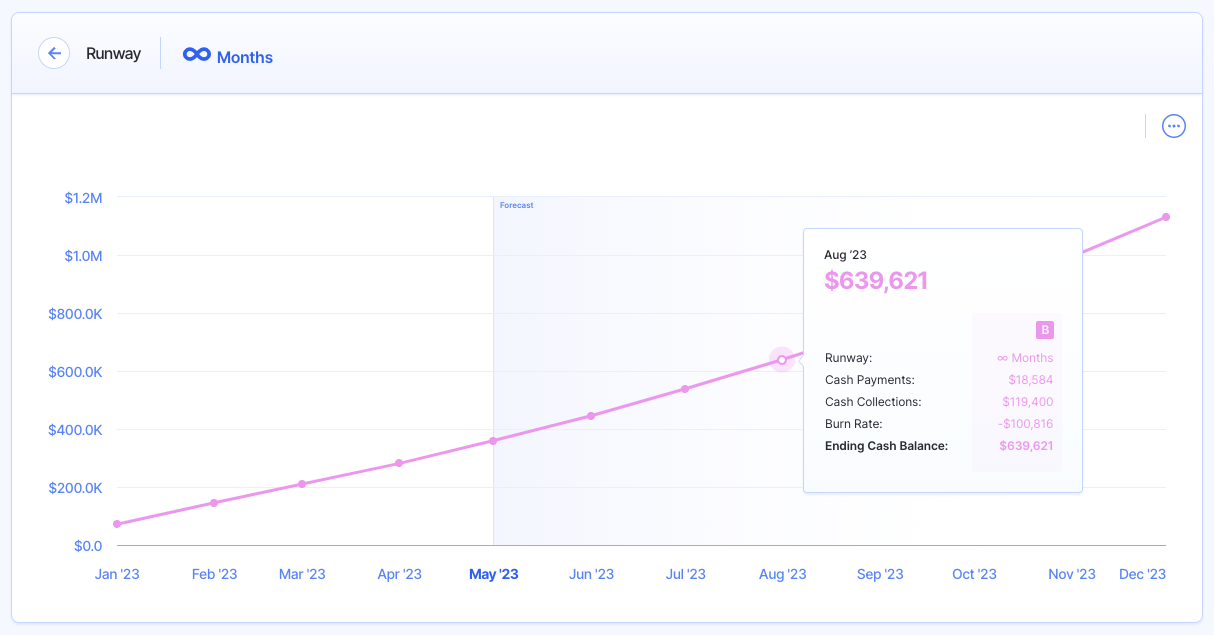
Cash runway is especially critical for young startups that haven’t generated a profit yet. And while it’s important to spend some cash to build and improve your product, spending freely without watching your cash runway is a surefire way to crash and burn.
To calculate your runway, you can use this straightforward formula:
Cash in Hand / Projected Burn Rate
If you notice you have a short runway, it means your startup is overspending for the amount of revenue it’s generating.
Your cash runway can also deter investors from funding your startup since they most likely hope their cash will go a long way to spur further growth.
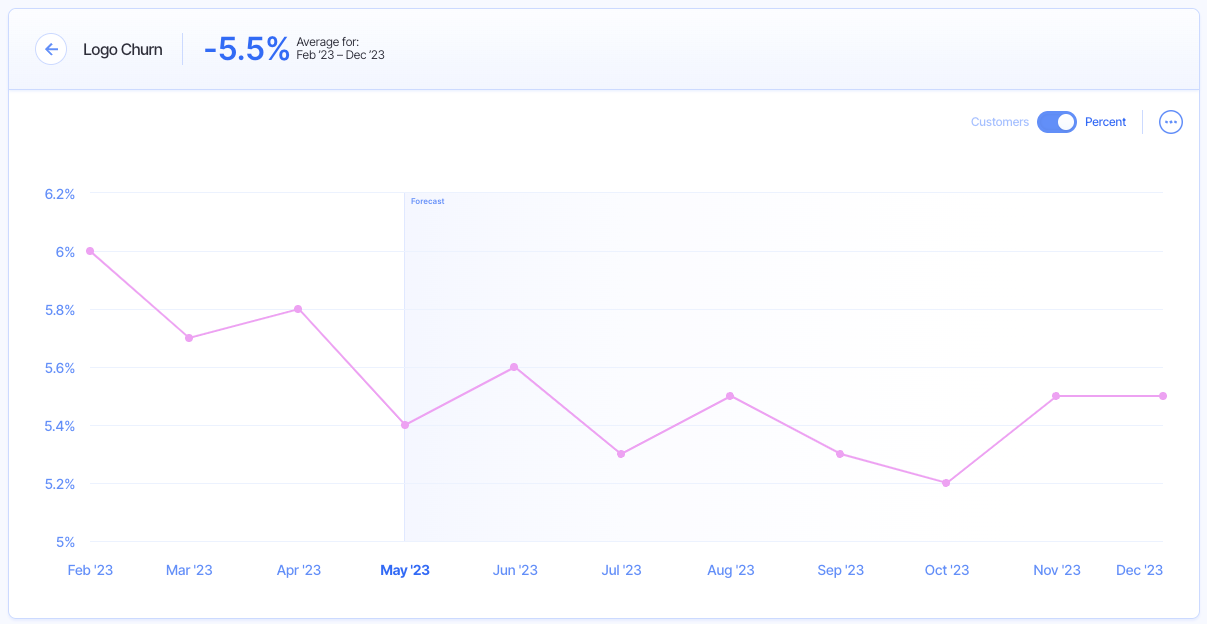
4. Churn
Customer churn is a startup’s worst enemy, though inevitable. It calculates how many customers you lose in a set period of time.
Because customers are constantly bombarded with the best new tools and apps, retaining customers long-term isn’t an easy task.
Your churn rate is expressed as a percentage, and you can calculate it using this formula:
(# of Churned Customers / Total # of Customers at the Beginning of the Time Period) * 100
A startup can only grow if its customer base grows, which isn’t possible if your churn rate is higher than your customer acquisition rate. If you don’t track your churn rate, you won’t be alerted when this happens.
On the other hand, tracking customer churn can help your startup take the necessary measures to increase your customer retention rate, like improving customer service or creating a better onboarding process for new customers.
5. Revenue Retention
The opposite of churn is retention.
Specifically, the revenue retention of your startup is a fundamental measure of the sustainability of your revenue growth. It represents the percentage of your revenue that is retained over a certain time period.
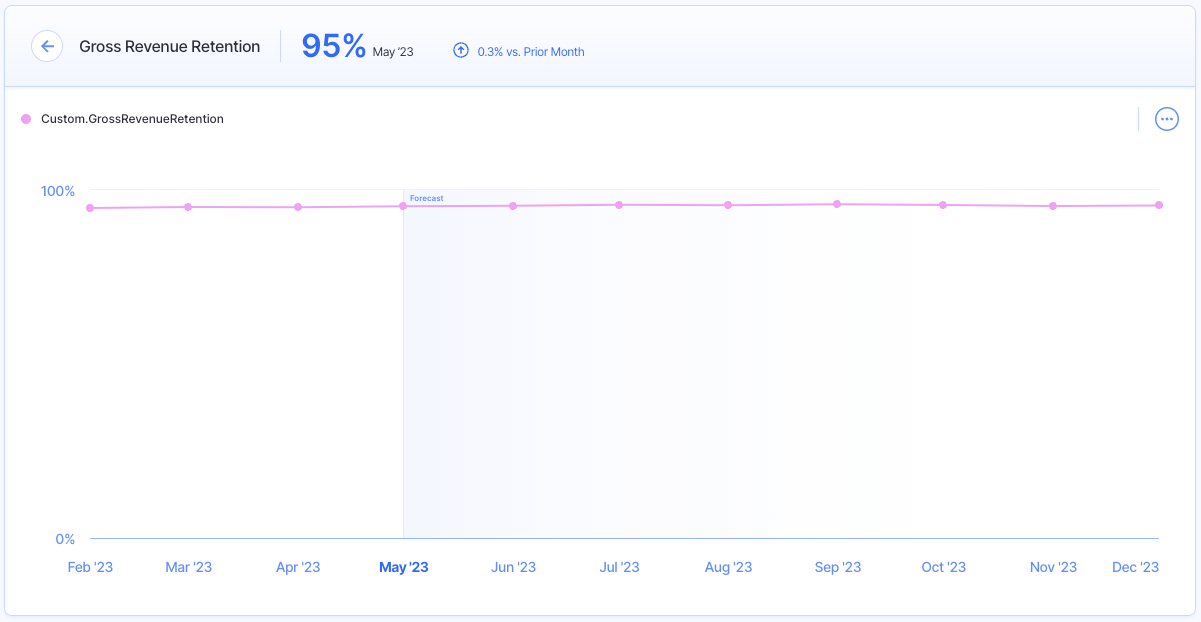
There are two main types of revenue retention your startup may track:
- >Net Revenue Retention
- >Gross Revenue Retention
You can calculate net revenue retention with this formula:
(Ending Total MRR in the Month – New MRR in the Month) / Ending Total MRR in Prior Month
And gross revenue retention with this formula:
1 – [(Churned MRR + Downgrade MRR) / MRR at the End of the Previous Month]
The difference between these two startup metrics is that net revenue retention accounts for the revenue you gained from upgrades and other factors, while gross revenue retention is more focused on the revenue you retained despite the customers you lost.
Again, some amount of churn is to be expected for all subscription-based businesses.
However, aiming for a higher revenue retention rate signifies growth for the business, and that you’re getting more revenue out of the customers you’ve already paid to acquire.
In fact, net revenue retention of over 100% points to growth in spending among existing customers.
Monitoring your revenue retention rate will help you determine if your customers are satisfied with your products, or if you need to make improvements to your product/market fit.
6. Average Revenue Per Account (ARPA)
Average revenue per account (ARPA) is the average monthly revenue generated from each paid account.
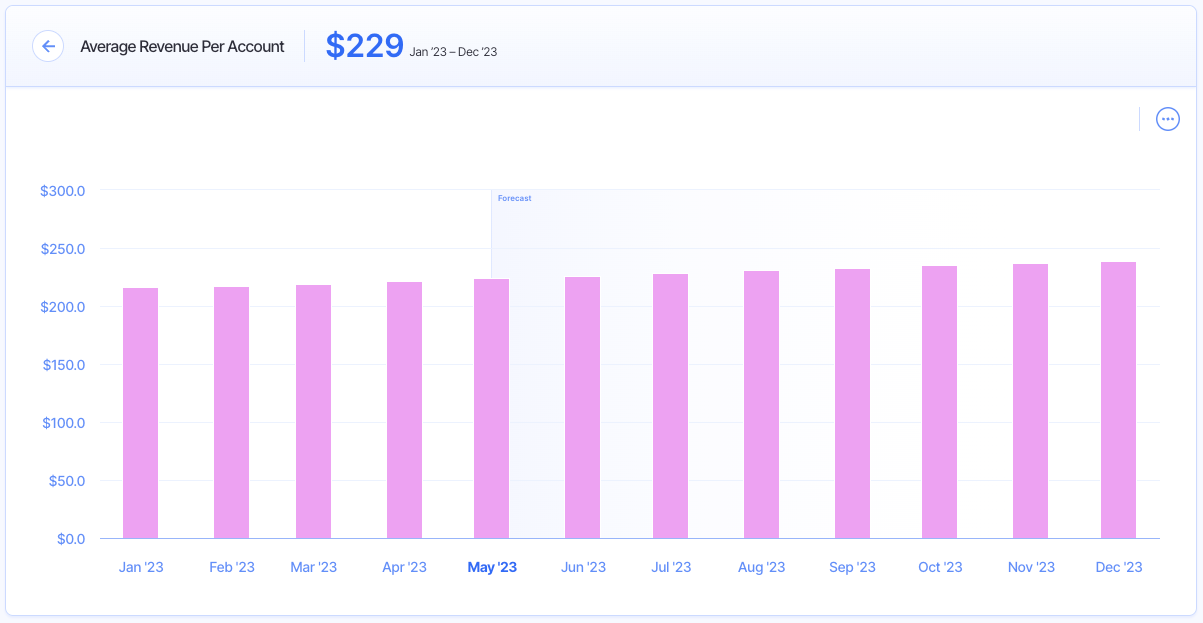
While they sound similar, ARPA is not to be confused with ARPU (average revenue per user).
There can be multiple users within one paid account, meaning there may be a difference between these two figures if an account has more than one user attached to it.
This is the straightforward calculation you can do to find ARPA:
MRR / # of Total Accounts
One key benefit of knowing your ARPA is you can objectively compare your performance against industry peers. This is a commonly reported metric that you can find for publicly-traded companies in their mandatory quarterly filings.
You can also compare the ARPA of your different subscription tiers or products as well to see how they stack up against each other.
ARPA makes it easier to assess your profitability and growth–an increasing ARPA month-to-month means your customer retention is good and your sales and marketing efforts have been effective.
Plus, the longer you track this metric, the more trends you’ll be able to gather on customer behavior and which subscription tier drives the most revenue, among other insights.
7. Revenue per Employee
Tracking your revenue per employee gives you a clear way to determine how much each employee generates in sales.
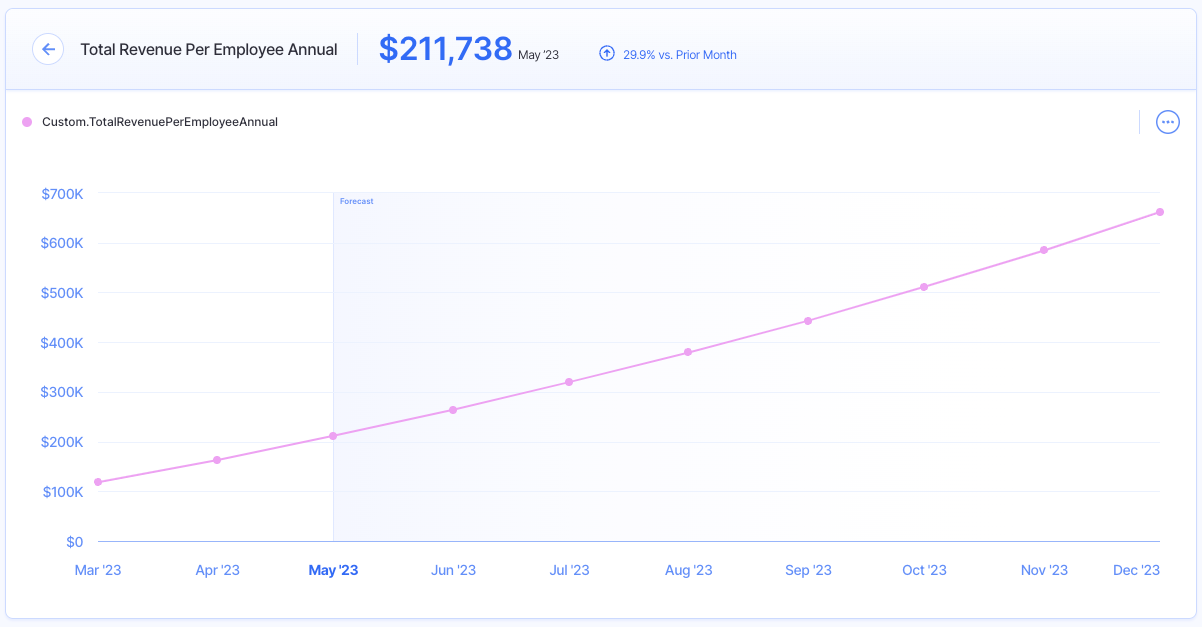
In all likelihood, your labor costs will be one of your biggest expenses. So while your employees are essential to the long-term success of your startup, it’s still important to assess the productivity of your team when it comes to generating revenue.
You can calculate this metric with the following formula:
TTM Total Company Revenue / Current # of Full-Time Employees
You may not necessarily rely on this metric alone to make crucial business decisions.
But, it can be very useful to monitor alongside other key startup metrics and industry benchmarks to see if your team is supporting your long-term growth targets.
8. Revenue Run Rate
A startup’s revenue run rate (sometimes referred to as annual run rate, sales run rate, etc.) is one of the key figures that founders rely on for the future planning of their business.
But, it can easily be miscalculated–which can lead to serious problems for the company down the road.
This metric helps you estimate the amount of revenue you expect your startup to generate over the next year based on previous performance.
Here is the formula you can use to calculate revenue run rate:
Revenue (during a specific time period) * # of Time Periods in a Year
The formula is quite simple and makes the assumption that current sales levels will remain or grow over the coming periods.
But, this ignores churn and other potential downgrades among existing customers.
Revenue run rate can provide a baseline expectation for what you expect your sales to be over the coming periods. However, make sure to assess it alongside other startup metrics to get a clear picture of your business’s health.
9. Gross Profit
Generating positive revenue growth is a great sign for startups. Being able to do so while building gross profit is an even better indicator of your long-term success.
Gross profit represents your earnings after accounting for the cost of goods sold (COGS), though it doesn’t consider your operational expenses.
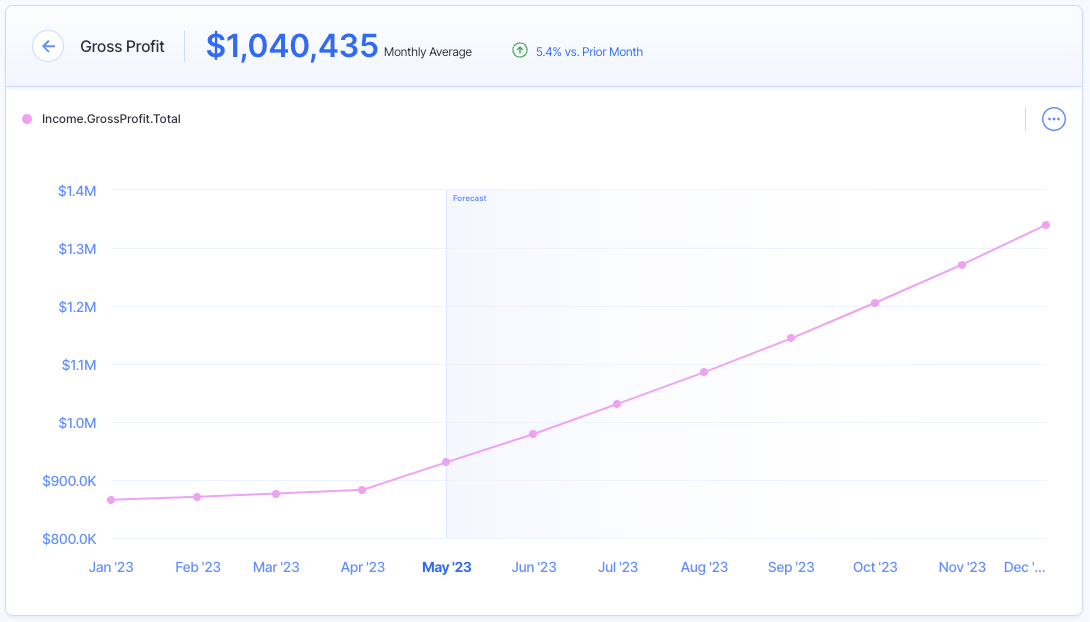
Here’s how to calculate gross profit:
Total Revenue – COGS
This is one of the most important startup metrics to investors, as they like to see that you’re turning a profit (or will at some point) and your operations are self-sufficient.
Younger startups may not generate a positive gross profit just yet. But, monitoring this metric over time will help you ensure that you’re improving your operational efficiency and are making strides towards profitability.
FYI: You can track and forecast all of these revenue metrics and more in Finmark from BILL!
Engagement Metrics for Startups
10. Activation Rate
Activation happens when a new customer performs a predetermined key action within your software within a set period of time. This key action should deliver value for customers.
For example, if your product is an invoicing software, this action could be creating and sending the first invoice. Or, if you have a website popup software, it could be launching the very first popup on a website.
Not all customers will perform this action within the time limit you set.
Activation rate calculates how fast new customers are achieving value within your software. You can calculate it like this:
# of Users That Performed a Key Action) / All Users
This metric helps you measure the success your customers are experiencing at the start of their journey. The more successful your customers are early on, the more likely it is that they will keep paying for your product and increase your LTV (lifetime value, covered later below).
11. Active Users (Daily and Monthly)
Not all paying customers are active users.
The number of daily active users (DAU) calculates how many customers use your product on a daily basis, whereas monthly active users (MAU) calculates customers who do so at least once a month.
There is no formula for calculating active users since it’s pretty straightforward.
Why should you care whether or not your customers are using your product? Just like activation rate, your active users metric measures whether or not your paying customers are getting value from your product.
If you have a high daily active user count, it means you are doing something right and providing an experience your customers enjoy.
On the other hand, a low number for both these metrics could indicate you are about to experience churn.
12. Time to Value (TTV)
How long does it take for a new paying customer to achieve perceived value from your software?
This is your time to value (TTV)—in this case, the perceived value is from the customer’s point of view, not yours. It depends on your customers’ expectations.
The faster customers can achieve value, the less likely they are to churn, so you should always aim to reduce this metric! You can do so by:
- >Creating easy-to-use onboarding guides
- >Providing customer success managers
- >Continually improving your product’s usability
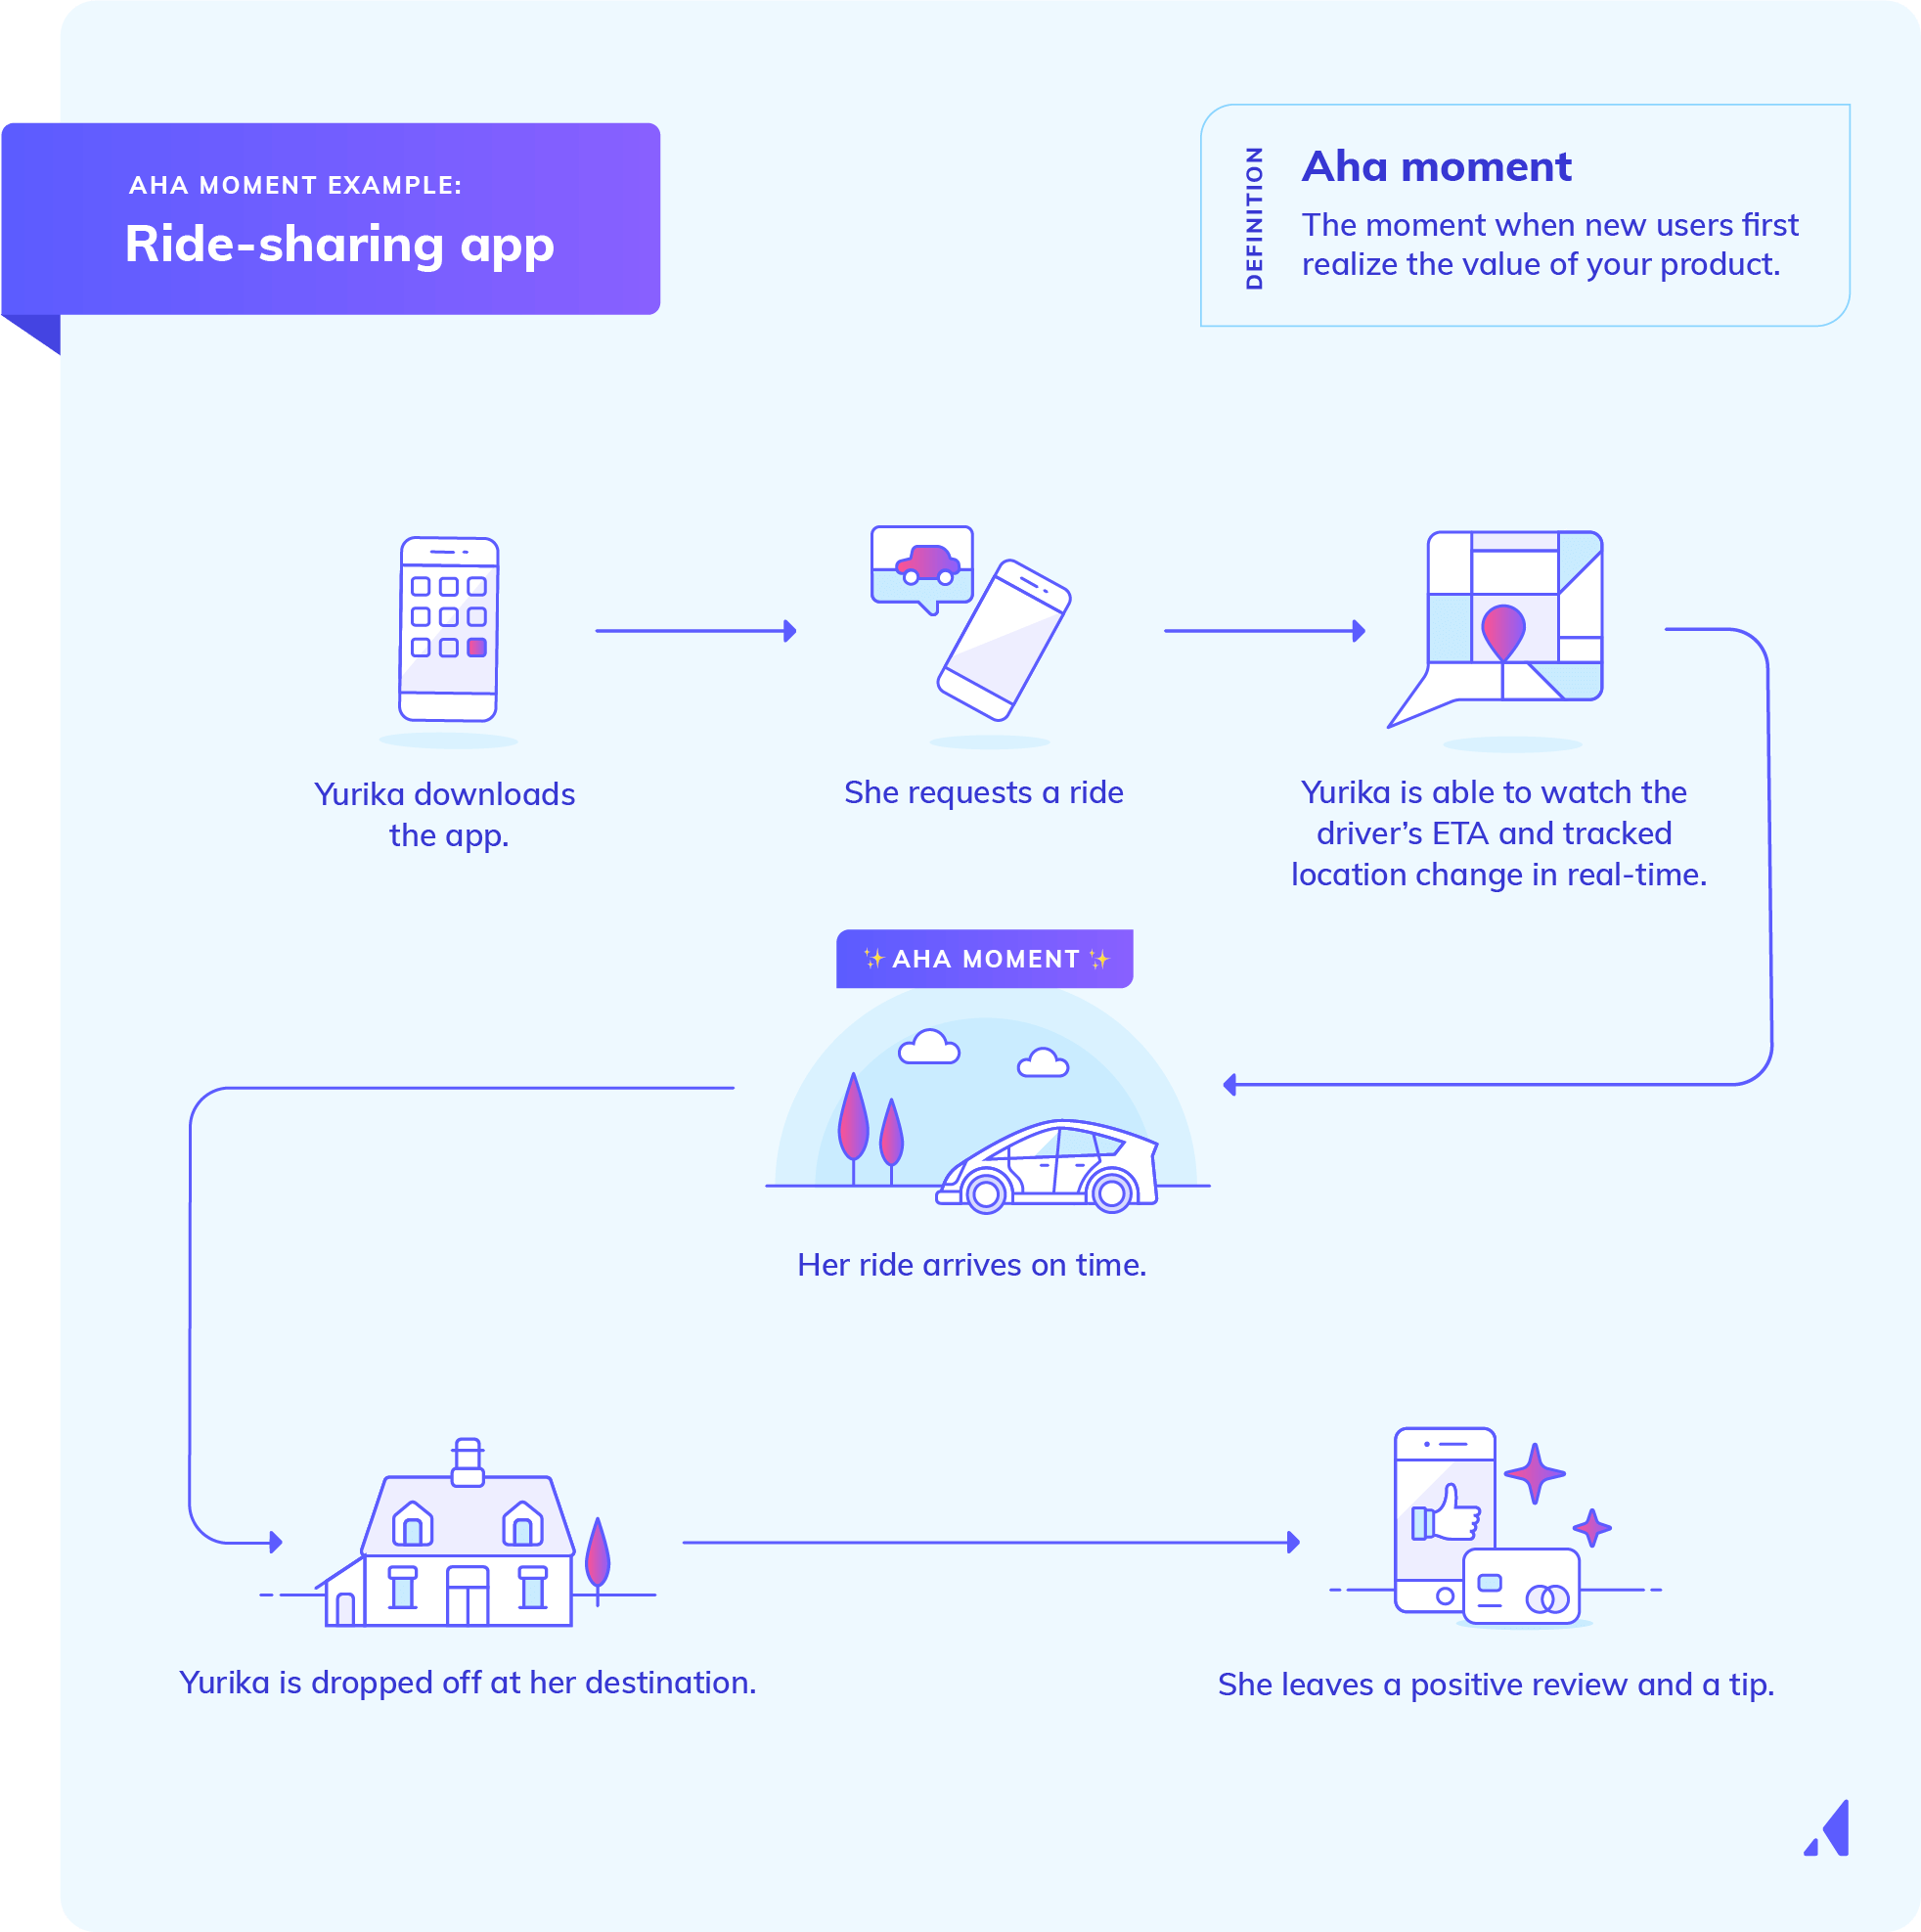
Calculating TTV depends on what ‘value’ means for your customers. What is the ‘aha’ moment most of your customers experience when they use your product?
Maybe it’s the simplicity of scheduling their first email sequence in an email marketing software. Or maybe it’s the first time you see your financial plan visually without having to work through endless spreadsheets.
Ideally, the aha moment should be something that can be measured and tracked. Here’s a visual example from Appcues.
You can use tools like Pendo, Mixpanel, and Amplitude to measure the engagement metrics above.
8 Marketing and Sales Metrics for Startups
13. Conversion Rate
The two main types of conversions most startups should track are:
- >Website visitor to lead
- >Lead to paying customer
To calculate the former, you need to perform the following:
(# of Leads / # of Website Visitors) * 100
And for the latter:
(# of Paying Customers / # of Leads) * 100
These metrics calculate how effective you are at acquiring new leads and then converting them into customers. A high lead conversion rate with a low customer conversion rate can mean your top-of-funnel acquisition strategy is highly effective, but your lead journey is missing something.
On the other hand, a low lead conversion rate could mean something is wrong with your top-of-funnel strategy. This could be due to:
- >Poor usability
- >Ineffective copy
- >Clunky flow
- >Failure to optimize opt-in forms
Conversion rate is crucial to keep track of since low conversion rates mean a higher customer acquisition cost (covered below).
If you can increase the rate at which visitors become leads and leads become customers, you can make the most of your traffic, paid or organic, and thus reduce your CAC significantly.
14. Leads
A lead is a person who has shown interest in your product—this could be defined as joining your email list, booking a free demo, or filling out a contact form on your website.
The number of leads your startup generates on a monthly basis, along with your conversion rate, will determine its ability to grow over time.
But not all leads are created equal!
Marketing qualified leads (MQL) are highly-qualified leads that have performed a key action that makes them ready to move down the next stage of your sales funnel. This could be engaging with a certain percentage of emails, performing a key action in their free trial, or downloading a specific free resource.
In the next stage, leads are passed on to your sales team and considered sales qualified leads (SQL). This means they are considered a potential customer. These leads are ready for the final buying stage.
Knowing the difference matters!
You can lose potential sales if you make a buying offer to leads that just aren’t ready yet. So, keeping track of both types of leads will help you better manage them and guide them throughout the appropriate stages of the sales funnel when they are ready.
15. Website traffic
Your website can be one of your most valuable marketing tools—but only if you’re getting traffic to it!
For example, if you have a high website visitor-to-lead conversion rate, but only get a few hundred visitors each month, this high rate won’t translate into meaningful sales growth.
You should keep track of your traffic from month to month since this will indicate whether or not your traffic-centric marketing efforts, such as SEO, email marketing, advertising, and others are proving to be effective.
16. Net promoter score
The most qualified leads are those that are referred by your existing customers—plus, they cost next to nothing.
That’s why you should keep track of your net promoter score (NPS).
Net promoter score is an index ranging from -100 to 100 that calculates how likely your customers are to recommend your product to a friend.
Calculating NPS will require a bit of effort on your part—you’ll need to survey your existing customers on how likely they are, on a range from one to ten, to recommend you to a friend.
Next, categorize your responses like this:
- >Promoters: 9 or 10
- >Passives: 7 or 8
- >Detractors: 0 to 6
Detractors are more likely to tell their friends to steer away from your product, whereas promoters are likely to sing your praises.
Now, subtract the total percentage of detractors from the total percentage of promoters—you can ignore passive customers for this equation.
If you surveyed a total of 100 customers, 12 are detractors, and 34 are promoters, 12% of your customers are detractors whereas 34% are net promoters.
Now subtract 12 from 34—you get 22.
This gives you an NPS score of 22.
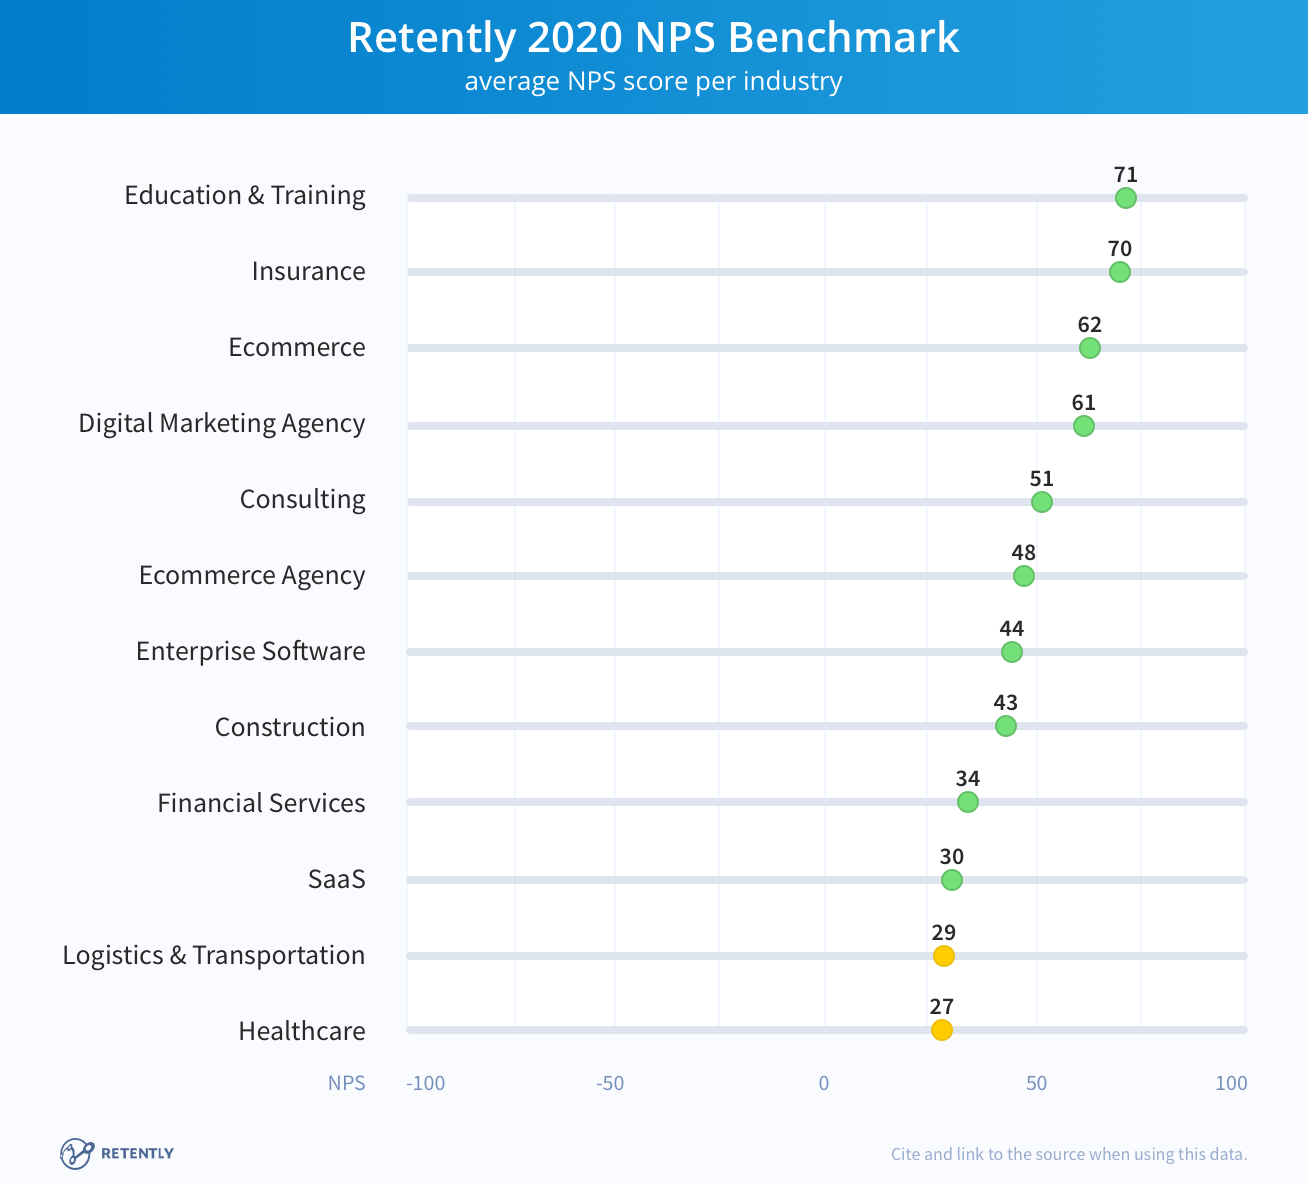
Wondering how your NPS stacks up against other startups in your industry? Here are some benchmarks from Retently.
17. Custom Acquisition Cost (CAC)
Gaining new customers always sounds great, but if the cost is too high, your startup could be digging itself into a hole.
That’s why tracking customer acquisition cost (CAC) is crucial to your long-term growth and success.
Customer acquisition cost is exactly what it sounds like—how much is your startup spending in sales and marketing to acquire a single customer?
Your CAC can indicate the effectiveness of your current sales and marketing strategies, and you can calculate it using the following formula:
Sum of Sales and Marketing Expenses / # of New Customers Acquired
Let’s take a look at the following chart to calculate an example:
| Channel | Spend | # of customers | CAC |
| Google Ads | $5000 | 50 | $100 |
| Facebook Ads | $4500 | 15 | $300 |
| Email list | $1000 | 50 | $20 |
Each channel shown above has its own CAC, while the average CAC is $91.
However, notice that CAC for Facebook ads is much higher than the other channels. This means you could optimize your strategy to lower it or cut it out altogether if you decide the channel is too inefficient.
Managing your customer acquisition cost is a tricky balancing act. If you spend too much to acquire a single customer, you won’t be able to sustain your growth and your burn rate will go up.
But not spending enough can mean your startup will experience limited growth.
Keep in mind that there is no ‘perfect’ CAC—it all depends on your average lifetime customer value, which we’ll cover below.
18. Lifetime Value (LTV)
Lifetime value (LTV) is the metric that represents the amount of revenue a customer will generate for your startup over the long term.
In other words, it’s how much revenue they’ll spend with your business before churning. Here’s how you calculate it:
Average Monthly Revenue per Customer * Average Duration Before Churn (in Months)
So if your average monthly revenue per customer is $45, and the average customer stays subscribed for 14 months, your LTV is $630.
Your LTV will tell you how much each new customer is worth to your business in revenue. But, where you can really glean valuable insights is by comparing your CAC to your LTV, which we will cover below.
19. LTV:CAC Ratio
Individually, your LTV and CAC metrics can tell you a lot about the effectiveness of your marketing efforts and customer satisfaction with your products.
But, comparing the two with the LTV:CAC Ratio will give you a clear indication of whether or not your startup can acquire customers cost-effectively.
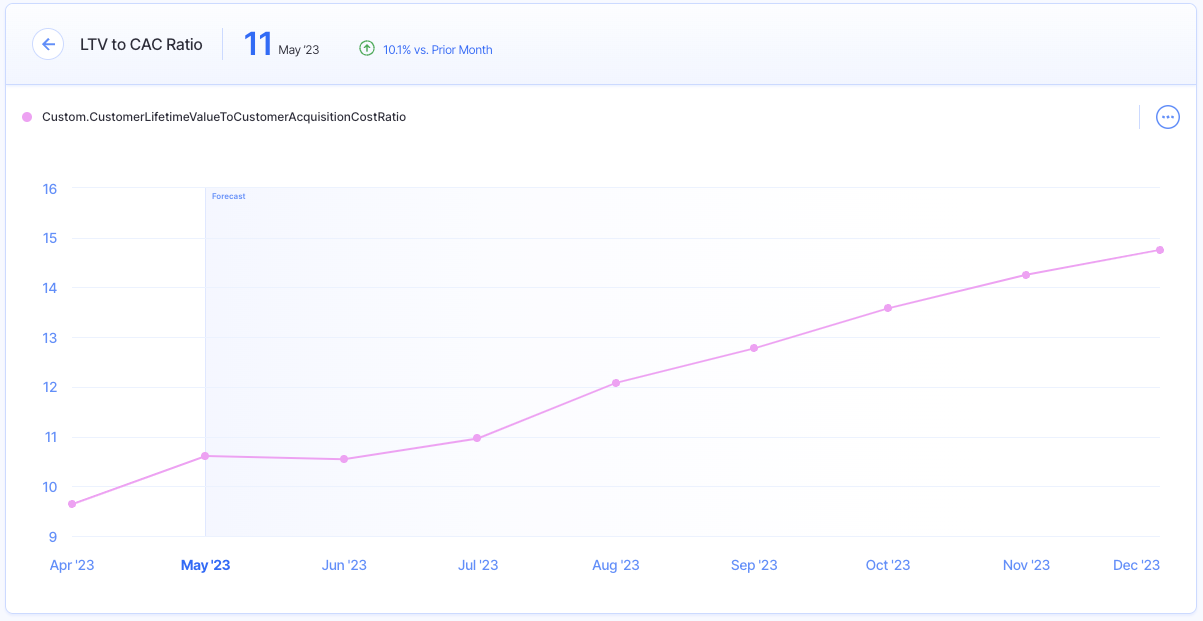
Here’s the simple formula for this ratio:
Customer Lifetime Value / Customer Acquisition Cost
If your LTV is lower than your CAC, meaning your LTV:CAC Ratio <1, you’re spending too much to acquire new customers and it’s not going to be sustainable long term. In other words, you’re losing money with each customer you acquire.
This means you’ll need to keep your customers around for longer by improving your product or customer service as well as your activation rate and TTV.
Your startup needs to spend money to acquire new customers, though you can’t outspend your LTV on marketing efforts and expect sustainable growth.
20. CAC Payback
Closely related to the previous few metrics is CAC payback, or the number of months it takes your startup to earn back its customer acquisition costs.
You can look at this figure as a way to determine the ROI of your sales and marketing efforts.
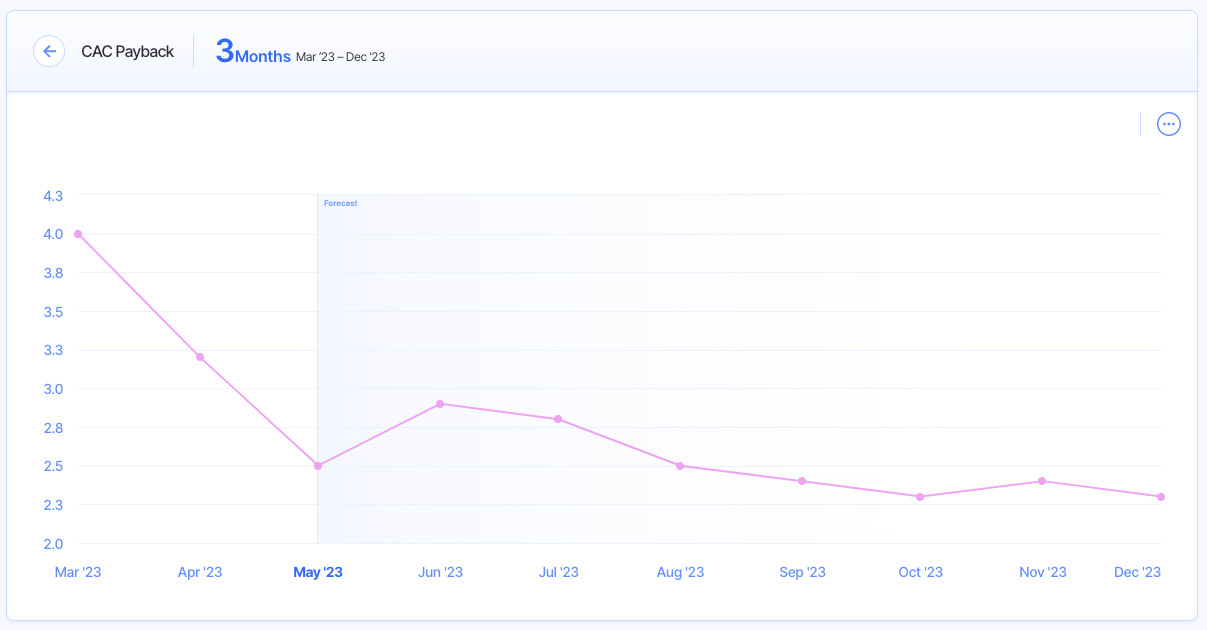
This is how you can calculate CAC payback:
Sales & Marketing Expenses / (New MRR * Gross Margin)
As we covered earlier, being able to bring in new customers for your startup is a good thing, but you need to be aware of how long it takes you to recoup those costs.
You should aim for a shorter CAC payback period, which means you’re able to break even on your CAC faster.
It’s also important to assess your CAC payback period alongside other sales and marketing metrics like your LTV. This helps you make sure that you’ll fully capture what you spent on customer acquisition costs before the customer churns.
In other words, a low LTV paired with a long CAC payback period could signal trouble for your business and keep you from building sustainable growth.
Grow Efficiently by Tracking the Right Startup Metrics
There are countless startup metrics that you can track and gain insights from. But, concentrating on the right ones for your business’s needs will help you focus on the most valuable actions you can take to steer your startup in the right direction.
With Finmark, you can easily measure and forecast nearly all the above metrics. Our intuitive financial management tool helps you monitor and track your startup’s performance, and customize your dashboard to gain visibility on the metrics you deem most important.
Visit Finmark online to start your 30-day free trial today!
Contributor
This content is presented “as is,” and is not intended to provide tax, legal or financial advice. Please consult your advisor with any questions.