3 Statement Model: A Complete Guide

Finance professionals too often get bogged down in complex systems of analysis. They spend hours poring over screens full of data when the story is all in the big picture.
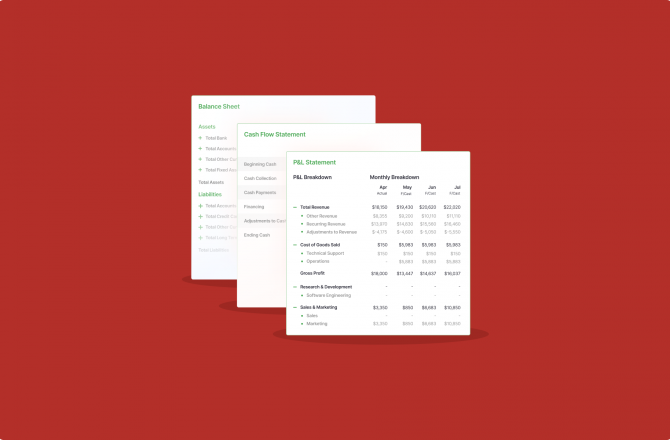
The three-statement model is a way of simplifying finance, using the three core financial statements to communicate critical financial information:
- Profit & Loss (P&L) Statement
- Cash Flow Statement
- Balance Sheet
By adopting the three-statement model, businesses gain a holistic view of their company and where it’s headed by modeling all three major financial reports.
In this article, we’ll explore how the three-statement model works in practice, covering basic steps to creating each statement as well as tips for using them to fuel and inform business growth decisions.
What Is The Three Statement Model?
The three-statement model is an approach to financial reporting that relies on just three core financial statements—profit and loss statement, cash flow statement, and balance sheet.
The first is the profit and loss statement. This communicates information about the company’s revenue and expenses for the period.
The second is the cash flow statement, which, as you’ve probably guessed, provides insight into how cash is flowing in and out of the business.
The final statement is the balance sheet. This documents the organization’s assets and liabilities, breaking them down by different levels of liquidity and urgency.
With these three statements in hand, finance teams can tell an effective story about past performance, comment on financial health, and make recommendations for strategic changes that C-Suite executives can use to make more informed business decisions.
Profit & Loss (P&L) Statement
The profit and loss statement, also referred to as the income statement, outlines your revenue sources and outgoing expenses for a given financial period.
It’s usually created on an annual basis, though most businesses also monitor it on a quarterly and/or monthly basis.
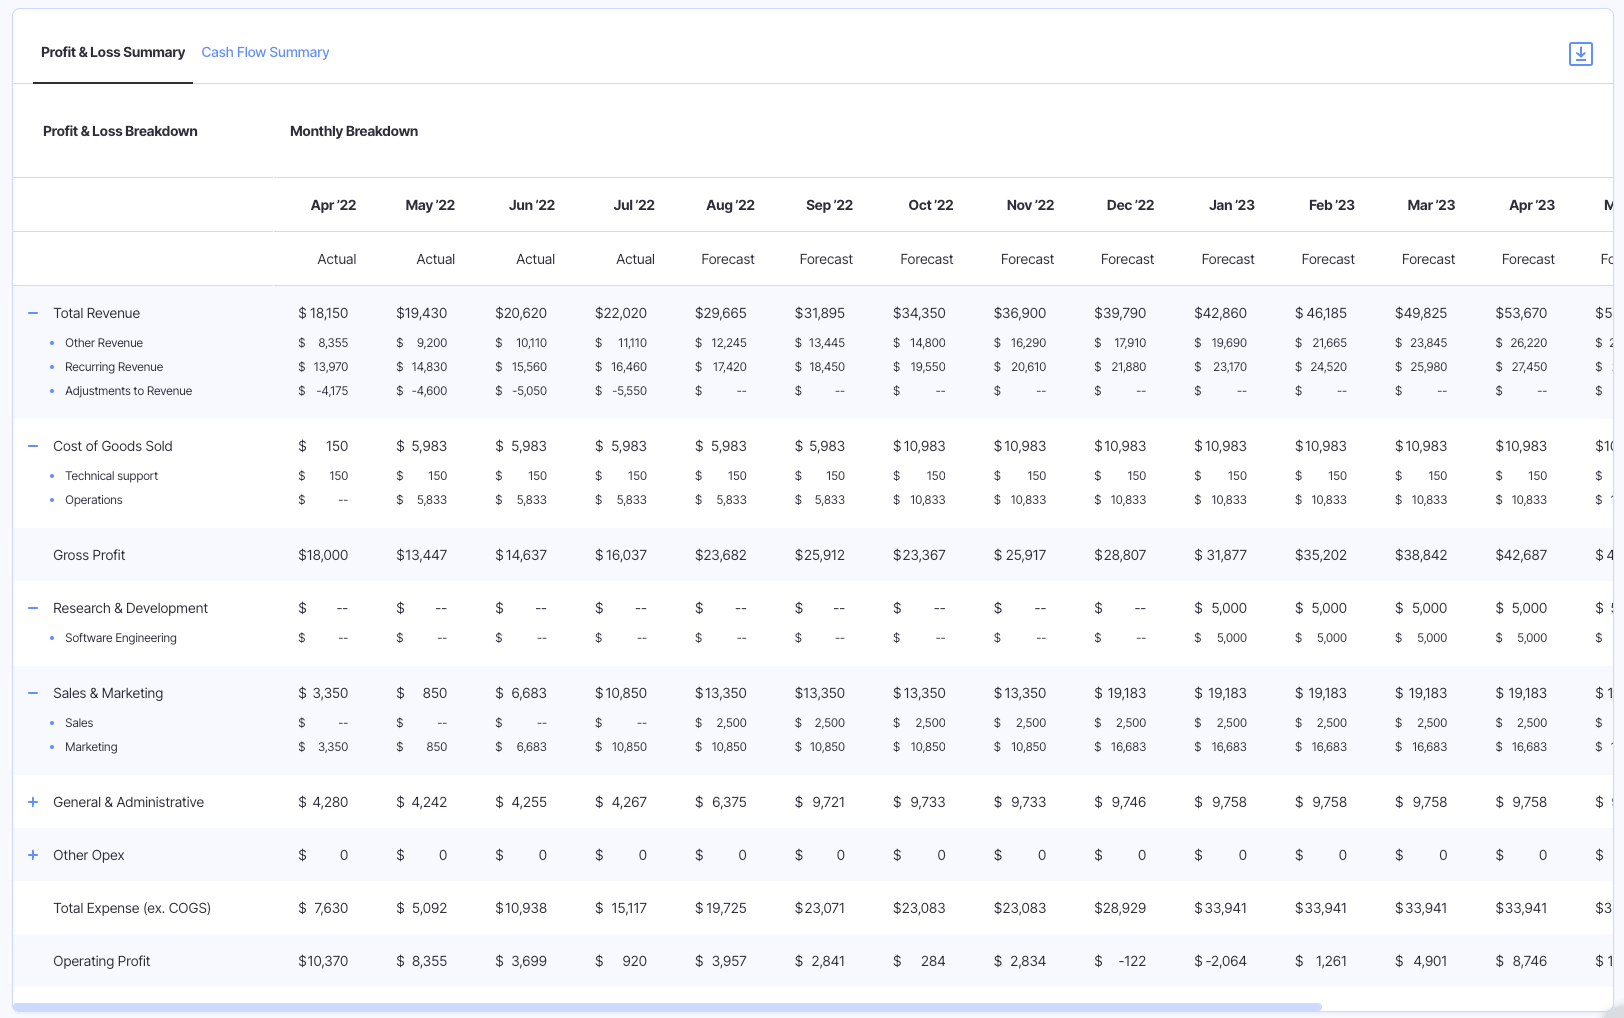
Here’s what they look like:

The P&L provides several layers of analysis.
For example, in the above P&L Summary in Finmark from BILL, you’ll see that the top line shows total revenue, with that total amount then broken down by the company’s various revenue streams.
The same goes for expenses, which are typically categorized by department. That said, the level of detail you go to, and the specific line items you include in your P&L depends on your company’s financial reporting needs.
How To Use A Profit & Loss Statement
The profit & loss statement serves two primary purposes:
- Looking back: Giving the finance team the ability to review the company’s financial performance for the previous period
- Looking forward: Providing an opportunity to consider strategic changes that could cut costs or increase revenue
As you analyze previous performance, you’ll use the profit & loss statement to discover key metrics like:
- Top line revenue
- Net income
- Expenses
- Earnings per share (if your company is public)
- Net profit (or loss)
Then, you can use your P&L statement to inform future growth strategies. Here are a few examples of how:
- Compare your P&L to your budgets to identify variance and improve budgeting moving forward
- Analyze trends in revenue drivers and revenue streams to inform strategic investments
- Compare your current P&L to previous reports to monitor growth (and quantify the impacts of any strategic initiatives you undertook during the previous period
- Identify your most influential cost centers and find ways to reduce them
Learn more about using the P&L statement to drive business growth in our guide: P&L Management: The Ultimate Guide For Startups.
How To Create A Profit & Loss Statement
- Identify your revenue from each stream
- Determine your cost of goods sold
- Subtract COGS from revenue to calculate your gross profit
- Pull together your overhead expenses
- Subtract overhead from gross profit to calculate your operating income
- Calculate remaining expenses and break them down by department
- Subtract these operating expenses from operating income to calculate your operation profit (also known as net profit)
Cash Flow Statement
The cash flow statement is pretty self-explanatory: it details how cash is flowing in and out of your business over a given period.
Cash flow should be measured on a monthly basis, and the best finance teams also use cash flow projections to create forecasts for the coming financial periods.
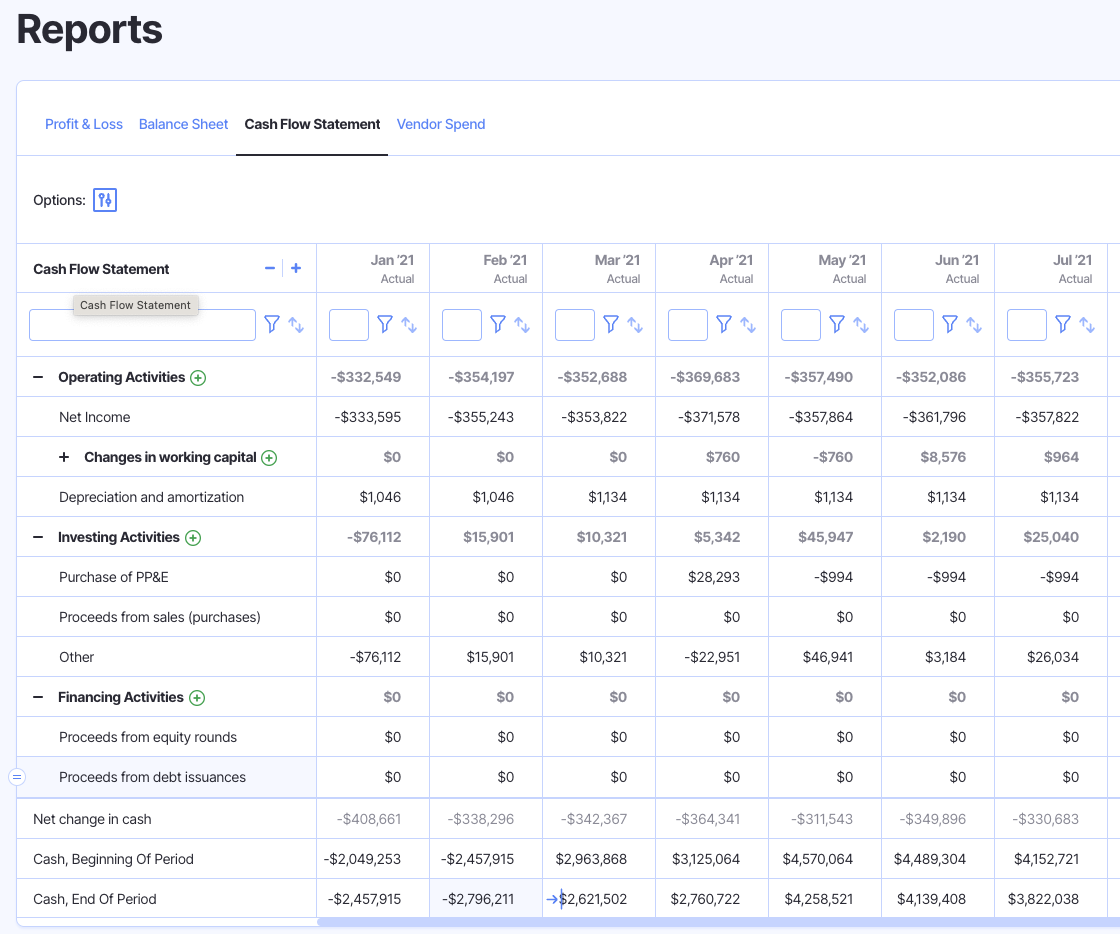
Take a look at the below example of a cash flow statement in Finmark.

You’ll see that the report for each month details:
- How much cash the company had at the beginning of the month
- The amount of cash that came in
- The amount of cash that went out
- How much cash the company was left with at the end of the month
How To Use A Cash Flow Statement
The first thing you want to know when reviewing your cash flow statement is whether cash flow is positive or negative.
This is a pretty simple distinction:
- Positive cash flow: You’re earning more than you’re spending
- Negative cash flow: You’re spending more than you’re making
It’s important to note that, while positive cash flow is generally better, its not going to be achievable for all companies.
For example, many early-stage startups are in negative cash flow for years, especially if they’re pre-revenue and relying on investor funding to develop a product.
However, even in this case, you’ll want to focus on reducing negative cash flow as much as possible, to keep your burn rate low and extend your cash runway.
From there, you can take a more detailed view by examining cash in and out across each month.
Ask questions like:
- What is the trend in revenue across months? Is there consistent growth?
- What is the trend in expenses? If expenses are increasing, is this increase in line with revenue growth?
- What do our cash reserves look like? Do we need to seek out more funding? If so, when?
How to Create A Cash Flow Statement
- Begin with your opening cash balance
- Add your revenue for the financial period (you can grab this data from your P&L)
- Include your total cash expenditure for the period (again, export this from your P&L)
- Calculate your closing cash balance by subtracting expenses and adding revenue to your opening balance
Balance Sheet
The balance sheet is the financial statement that rounds out the three-statement model.
Balance sheets outline a company’s assets, liabilities, and shareholder’s equity at a given point in time.
These financial statements are most commonly created on an annual or quarterly basis.
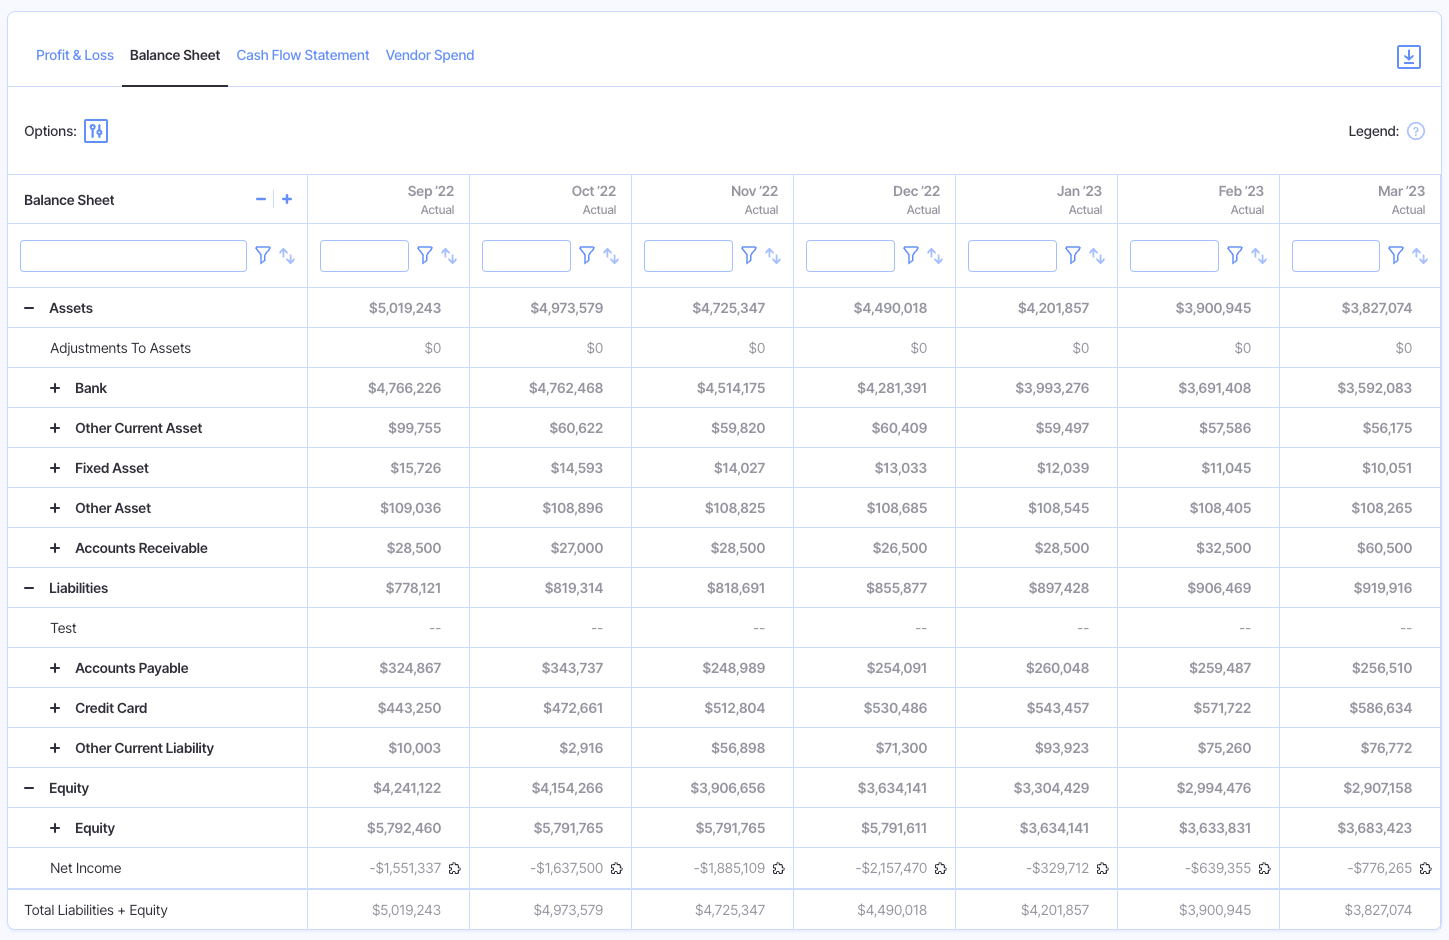
Here’s what a balance sheet might look like in Finmark:

Note that there are three broad categories:
- Assets
- Liabilities
- Equity
Each category is then broken down into subcategories. For example, a company’s assets are then detailed as:
- Current bank account
- Accounts receivable
- Other current assets
- Fixed assets
How To Use A Balance Sheet
Balance sheets are primarily used to assess financial risk.
When you review a balance sheet, you’re analyzing your company’s available assets in comparison to its liabilities.
You’ll most urgently look at current assets vs. current liabilities.
Current liabilities are those that are due soon, like a credit card bill (compare this to long-term liabilities like a mortgage). Current assets are those that are most liquid, such as cash and accounts receivable.
You’ll assess risk by determining your company’s ability to repay its current debts using its most liquid assets.
If your current assets are higher than current liabilities, you’re safe. If not, you’ll want to think through how you can quickly obtain more cash (without increasing current liabilities).
Your balance sheet can also be used to obtain funding, as lenders will want to understand your company’s debt exposure and available assets before approving a business loan.
How To Create A Balance Sheet
- Calculate your total assets
- Break assets down by liquidity (cash, current assets, fixed assets)
- Determine your current liabilities
- Calculate your total long-term liabilities
- Work out owner’s equity (combination of share capital plus retained earnings)
- Add owner’s equity to liabilities as a double check (this total should match your total assets)
Build Your Three Statement Financial Model Faster
The three statement model is a powerful minimalist approach to financial reporting.
Though these three financial reports are relatively simple to prepare, doing so can be time-consuming, especially for larger organizations.
Finance teams should be focusing their time and energy on strategic analysis and planning, not on putting financial reports together.
That’s why the most effective finance teams use financial modeling platforms to centralize their financial data.
Learn more about those incredibly helpful tools in our guide: What Are The Best Financial Modeling Tools?
Or, skip the whole process and jump straight into a 30-day trial of Finmark, the financial reporting and modeling platform that makes running a three statement model seamless.
Contributor
This content is presented “as is,” and is not intended to provide tax, legal or financial advice. Please consult your advisor with any questions.
