8 Operational Metrics & KPIs Every Business Should Track
There is a wealth of data available to business leaders today on the overall economy, their customers, and very importantly, their own company.
In today’s data-driven world, simply having the data on hand is not enough to gain real insights into the health of a business.
Instead, modern companies can take advantage of the available data to evaluate their performance, gather insights, and make information-driven decisions that will move the needle forward for their business.
With clear operational metrics, a business can objectively evaluate its operations, strategic growth initiatives, and more to decide what’s working, and what areas need improvement.
Throughout this guide, we’ll give you an explanation of what operational metrics and KPIs are, and provide you with a list of eight crucial metrics your business should monitor to support long-term success.
What are Operational Metrics?
Operational metrics are a type of indicator that businesses can use to measure and track their performance during a given period.
Oftentimes, these metrics will provide business leaders and key decision-makers with insights into their key processes, showing how efficient or productive the company is.
A distinction of operational metrics is that they give a numerical measure to business tasks or procedures so they can be monitored and analyzed. For instance, a company will track its revenue over time as a way to objectively measure its growth.
What are KPIs?
Similarly, key performance indicators (KPIs) are high-level, strategic measurements that are often tracked in real time and give a snapshot of the company’s current profitability, efficiency, and positioning in the market.
KPIs show how a company operates on a day-to-day basis. In other words, they can reflect the success of the company’s overall strategy.
So if a company has a goal to improve the efficiency of its sales outreach efforts, it can start tracking the number of sales calls a representative makes each week and the percentage of those calls that lead to sales.
What’s the Difference Between Operational Metrics & KPIs?
While operational metrics and KPIs can appear similar, they each provide their own unique insights into the business.
Namely, operational metrics tend to be values that the company tracks over time to monitor their performance and look for ways to make improvements. These metrics often involve high-level business processes, like sales, that are essential to the solvency and long-term success of the company.
On the other hand, KPIs are a type of metric that is of particular interest to the company at a given time, and are typically tied to distinct goals or objectives that the organization is working towards.
In this sense, all KPIs are considered operational metrics, but operational metrics aren’t always considered KPIs.
Why Should You Track Operational Metrics?
Both operational metrics and KPIs play an important role in the decision-making process of business leaders.
Primarily, tracking these values gives businesses a way to clearly and objectively evaluate their performance, seeing areas where they’re performing well, or where they can make improvements.
Plus, it can help them identify any bottlenecks or inefficiencies in their operations. If a business notices poor performance somewhere in the organization, they can use their tracked operational metrics and KPIs to help point to the culprit and quickly generate solutions.
If a company sees decreasing sales quarter to quarter, they may dive deeper into their KPIs and notice that sales call volume was down substantially between the two periods.
With this information, they can meet with the sales team to come up with new goals and objectives to reverse the trend over the coming period.
Top 8 Operational Metrics & KPIs to Track for Your Business
With a better understanding of what operational metrics and KPIs are and the important role they play, we can now reveal the top values that companies should track to support their growth.
Keep in mind that this is in no way a comprehensive list of all the possible operational metrics or KPIs out there, though these can give you a strong baseline to monitor your business performance.
Plus, depending on the business’s industry and strategy, some of these metrics may be more relevant than others.
1. Revenue Growth (Y/Y)
Department: Finance
Revenue Growth (Y/Y) Formula: [(Sales this year – sales last year) / Sales last year] * 100
Tracking your yearly revenue growth will show if your business’s sales are growing from year to year, and is the baseline measurement of your organization’s health.
This is a commonly referred to metric by leadership, investors, and stakeholders, and can be found clearly at the top of the income statement.
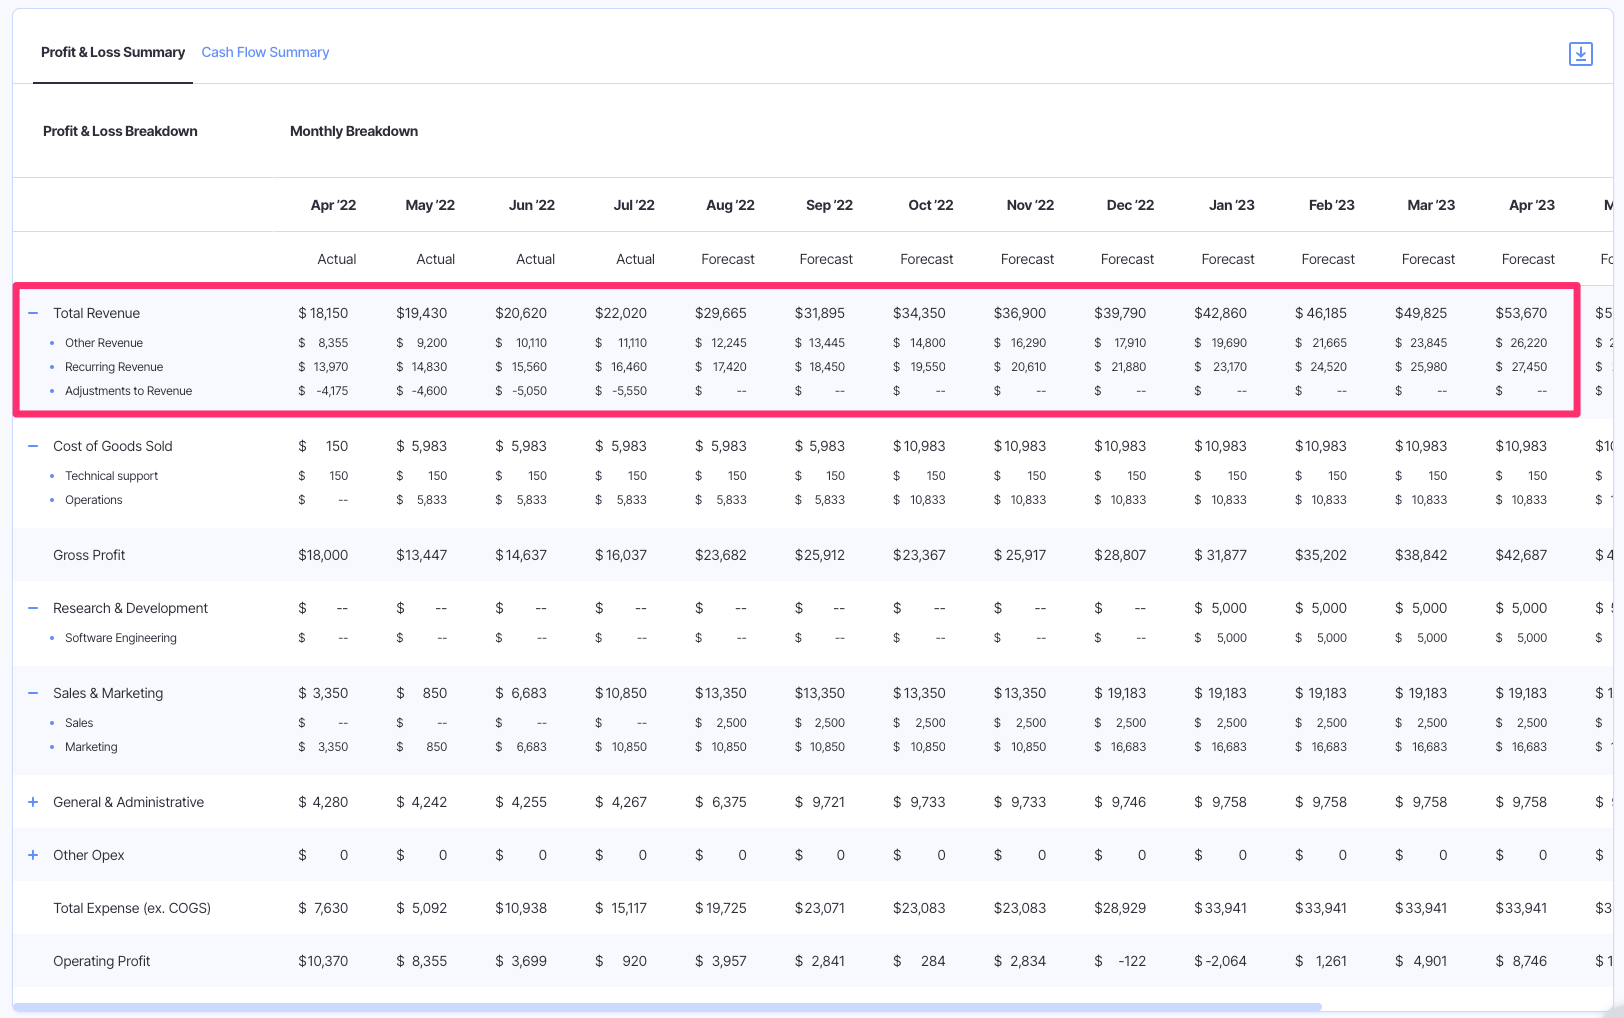
By monitoring the change in total revenue over the years, you will have a clear indication of whether your business is growing, stagnating, or shrinking, and how effective your strategic growth initiatives are.
All in all, bringing in revenue is the life force for the business. So, it’s important to understand the internal levers and external factors that can impact this value.
Say the organization faces a round of layoffs, which hit the sales team hard and reduces their headcount by half. In the following period, it can be expected that revenue will be down.
Conversely, if the company invests heavily in marketing and promotional activities, they can expect an uplift in sales in the coming period.
2. Gross Profit Margin
Department: Finance
Gross Margin Formula: (Revenue – Cost of Goods Sold) / Revenue
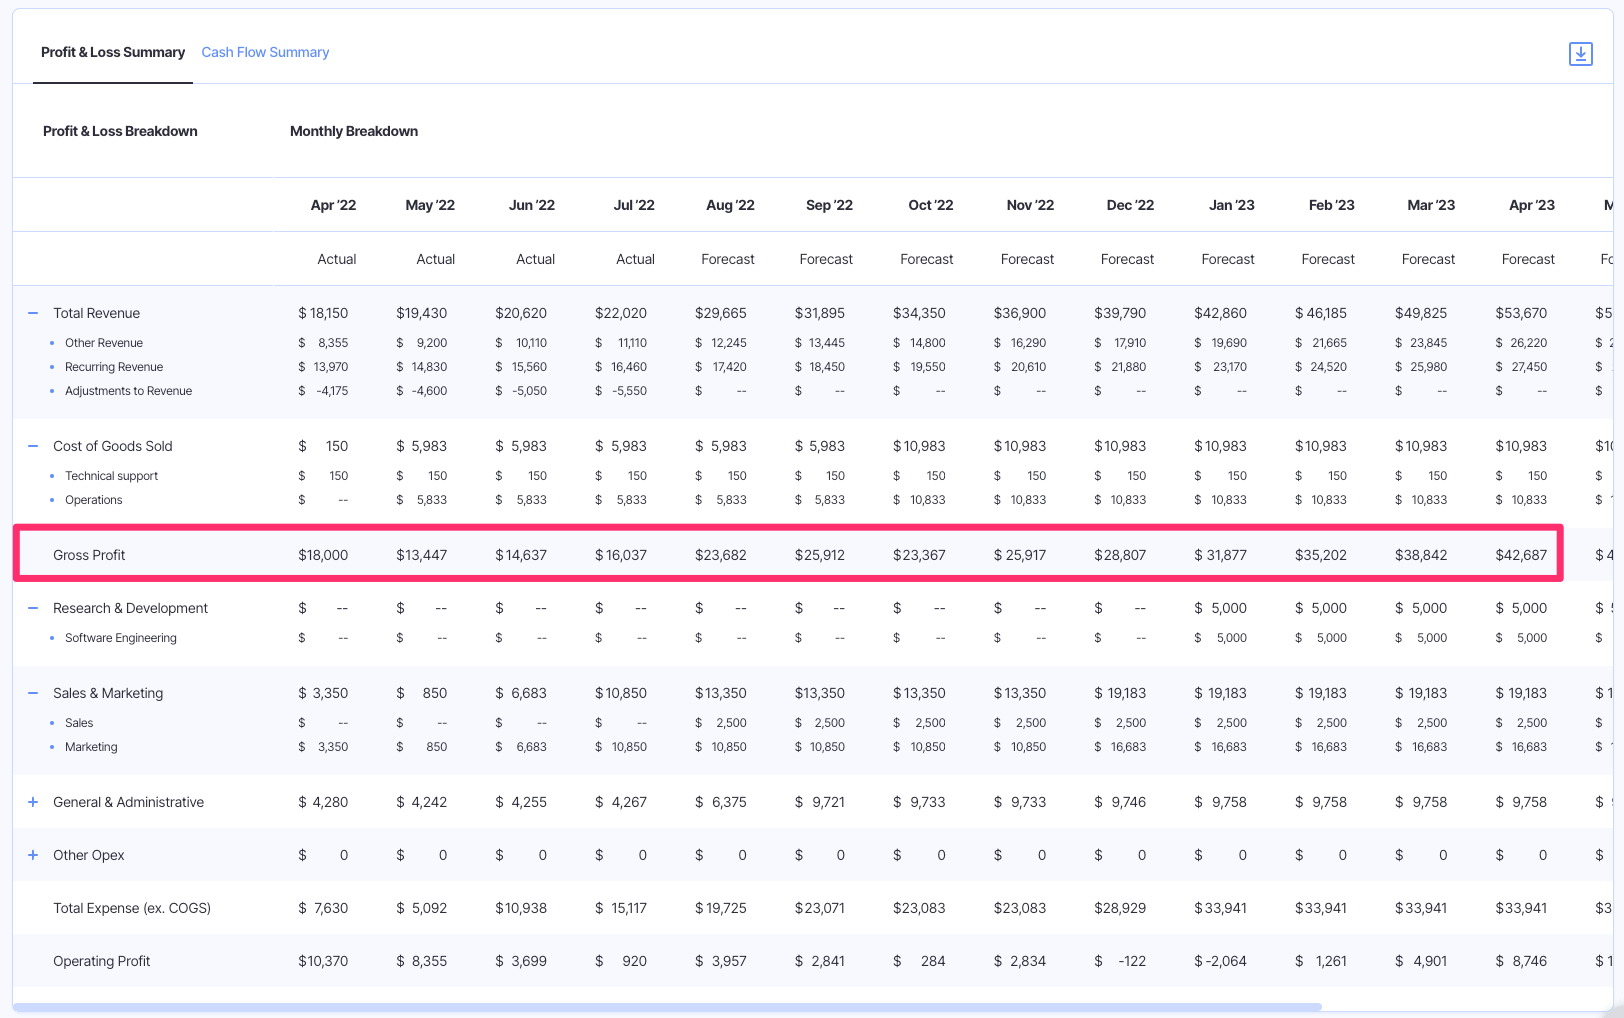
Gross margin is one of the most commonly tracked metrics by finance departments, and is often of interest to investors and stakeholders of the business. It can easily be found on your income statement as a standalone value of gross profit, or as a percentage of your revenue.
Your gross margin will tell you how much revenue you’re retaining after accounting for the direct costs you incur to produce the product or service, or your COGS.
This doesn’t include additional costs you may incur like General & Administrative Expenses or Sales & Marketing Expenses. So, your gross margin is the amount you have left over to cover your operating expenses.
Ideally, you will generate enough gross profit to fund the rest of your operations, otherwise, you may need to seek out ways to cut costs in the meantime to avoid a loss for the period.
3. Customer Acquisition Cost (CAC)
Department: Sales/Marketing
CAC Formula: Sum of Sales and Marketing Expenses / # of new customers acquired
The customer acquisition cost (CAC) is an important value for marketers to track. It reveals the cost that the company pays to acquire a new customer. Basically, how much marketing spend do you need to bring in a sale?
If you put $100 into Instagram ads which brought you 4 leads, and one turned out to be a customer, your CAC is $100.
Assuming that your business doesn’t have an endless budget to spend on marketing and sales, tracking and understanding the CAC will help you determine how efficient your marketing efforts are, and whether it’s sustainable for your business.
Spending too much to acquire new customers may keep you unprofitable, while spending too little may limit your growth potential.
So, finding the right balance with your CAC is something your marketing department will have to work on to ensure you’re supporting the business’s profitability levels, but also meeting growth targets.
4. Customer Lifetime Value (CLV)
Department: Sales/Marketing
LTV Formula: (ARPA * Gross Margin) / Revenue Churn
Closely related to CAC is the customer lifetime value (CLV). This metric will help you understand the total gross profit that a customer will generate for your business over time.
Calculating your CLV will depend on a few factors, including the length that someone remains a customer of your business, the average revenue per account, your gross margin, and your revenue churn.
When taken together, the CAC and CLV will help you determine whether you’re spending too much on customer acquisition–or not enough. So, if your CAC is $400 and your CLV is $300, you may need to head back to the drawing board to see how you can get your acquisition costs lower, or how you can get customers more invested in your product and make more orders.
5. Churn Rate
Department: Sales/Marketing
Churn Rate Formula: (# of churned cust. / total # of cust. at beginning of period) * 100
The customer churn rate, sometimes referred to as customer attrition, customer turnover, or client churn, refers to the percentage of customers you lost during a certain period.
This is a particularly useful metric for SaaS or other subscription-based businesses that generate recurring revenue from their customers.
For example, if you started the quarter with 300 customers, and lost 30 of them by the end of the quarter, you had a 10% churn rate.
As you may be able to guess, churn rate is something you’d like to see go down rather than up–meaning you are losing fewer customers each subsequent period.
When you have a higher churn rate, you will face more challenges while trying to grow since you’ll constantly need to replace the churned customers before you can build any growth.
While unavoidable, being able to keep your churn rate at a manageable level will have positive implications for the long-term potential of your business.
6. Annual Recurring Revenue (ARR)
Department: Sales/Marketing
ARR Formula: (average monthly revenue per customer * total number of customers) * 12
Business leaders can also gain a lot of value by tracking their annual recurring revenue (ARR), or the amount of predictable revenue generated by customers each year. This is a similar measurement to monthly recurring revenue (MRR), though on a larger time frame.
Like churn rate, ARR is most applicable to subscription-based businesses since they have predictable and recurring revenue from their subscribing customers.
Without a consistent flow of income, these types of businesses would cease to exist. So, it’s worthwhile for businesses to monitor their ARR over time to ensure they can continue generating consistent revenue to support operations.
Plus, investors are often interested in ARR as a valuation metric for the business, whereas MRR is more representative of the day-to-day operations of the company.
7. Inventory Turnover Rate
Department: Manufacturing/Operations
Inventory Turnover Rate Formula: COGS / average value of inventory
Another metric that is pertinent to leadership is inventory turnover rate, or the rate at which the company turns over its inventory during a given period of time as related to its COGS. This is a type of efficiency ratio that helps a business, particularly one in retail or e-commerce, measure how effectively it uses its assets.
In general, a low inventory turnover ratio can signal weak sales or excess inventory. A high ratio indicates strong sales, but it can also mean that the company’s ordering and inventory stocking isn’t sufficient enough to meet customer demand.
Other factors like seasonality and changing costs can distort the ratio, though it’s still an important metric for retailers to track in order to make informed decisions related to promotional activities, pricing, ordering, warehouse practices, and more.
8. Burn Rate
Department: Finance
Burn Rate Formula: Cash payments – cash collections
Lastly, your cash burn rate is a metric that will reflect whether the business is outspending the cash on hand. Burn rate can be a valuable measurement when you’re determining your cash runway, or the number of months you have until your cash is completely depleted.
Essentially, figuring out your burn rate relies on a simple calculation that shows how much money you are spending each month, and is defined by the negative free cash flow generated during a given period.
If your burn rate is positive, that means you are spending in excess of your revenue for the given period, and a negative rate means you’re profitable and retaining a portion of the cash you received.
For instance, if your burn rate for the month is -$2,000, that means you actually saved money during the month and spent $2,000 less than you received.
Track Your Operational Metrics and KPIs like a Pro with Finmark
By tracking your operational metrics and KPIs, you will have a better handle on your business’s performance, and quickly gather the insights you need to make informed decisions.
The specific operational metrics and KPIs you measure and track will vary depending on your specific industry and strategic goals. Plus, you may add or subtract metrics from your reporting over time as they become more or less relevant to your business.
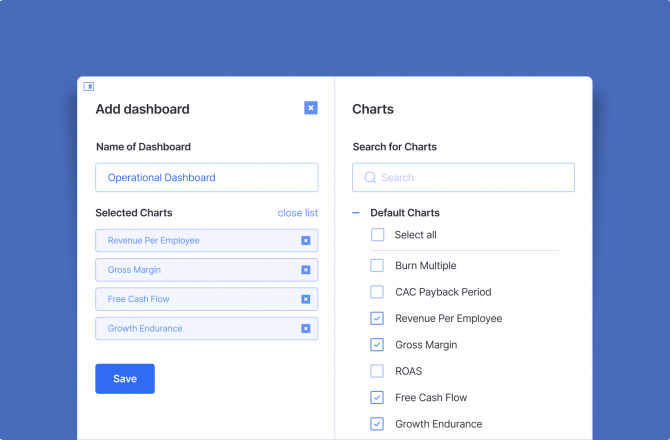
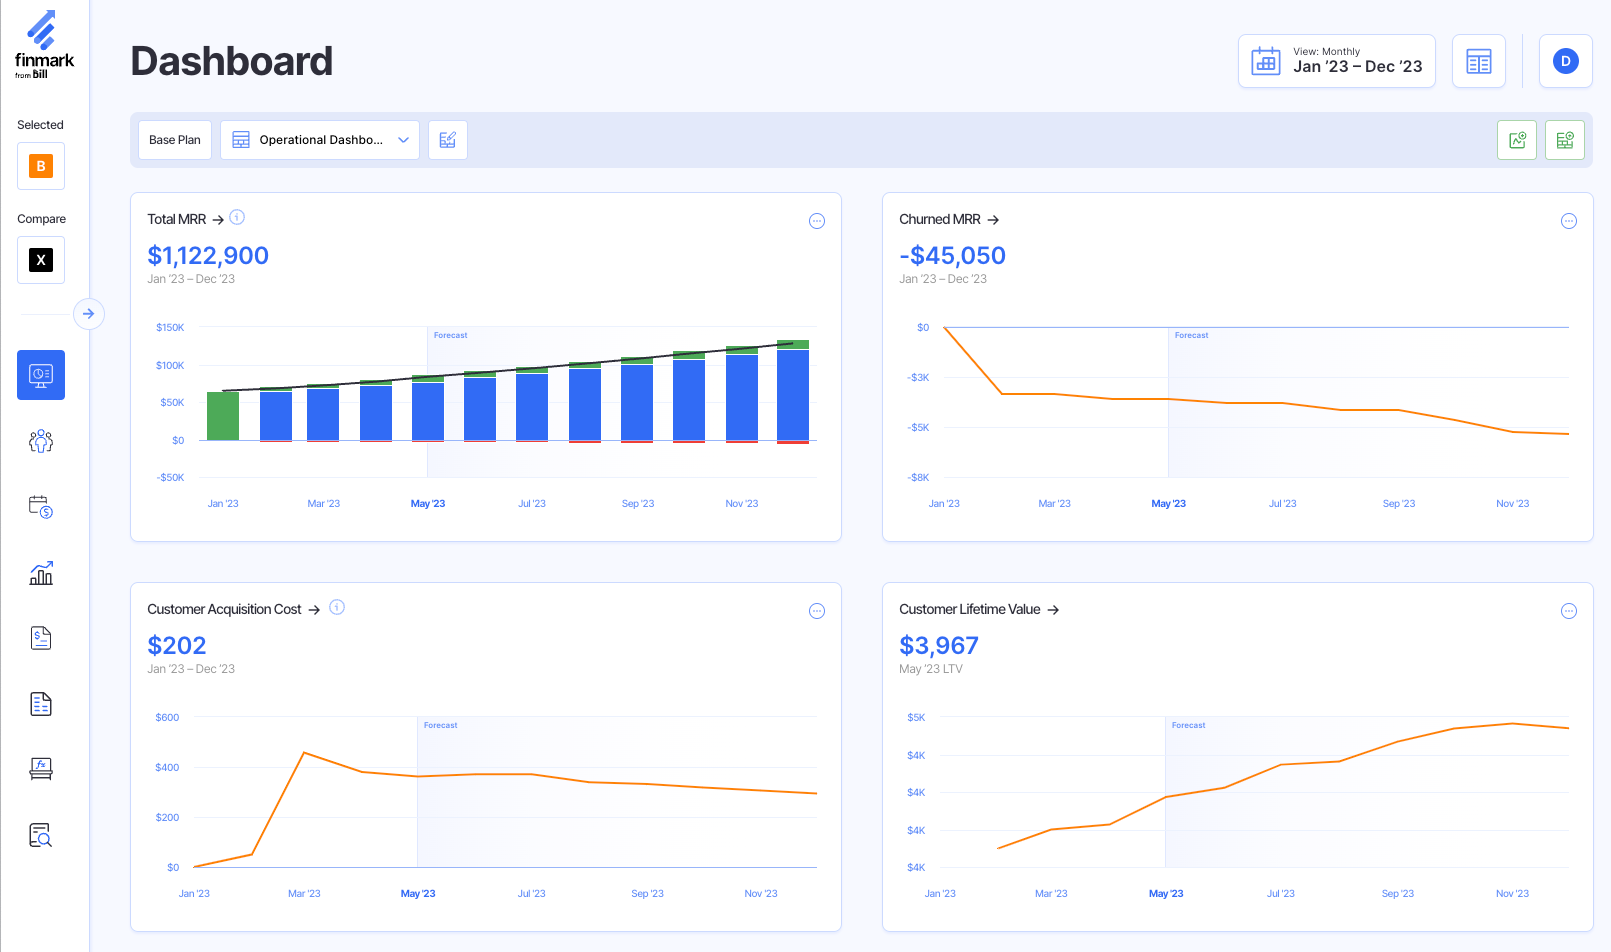
If you use a powerful and intuitive financial planning platform like Finmark from BILL, you can seamlessly track more than 100 different metrics all in one location. By searching through our wide selection of out-of-the-box metrics, you can find easily the KPIs that best fit your business.
Try Finmark for free to see how we can transform your performance-tracking experience.
Contributor
This content is presented “as is,” and is not intended to provide tax, legal or financial advice. Please consult your advisor with any questions.