20 Financial Metrics Every Business Should Track

Financial metrics are vital for assessing the performance and health of any business. From revenue and profitability to the costs you incur to attract new customers, there are various key indicators that every company should track and monitor regularly.
By keeping a close eye on these financial metrics, you can gain valuable insights into your business’s financial health, identify potential areas for improvement, and make data-driven decisions that drive growth and success.
Though there are a ton of financial metrics that you can track, including the ones listed below, we recommend finding the KPIs that are the most important and relevant to your business based on your unique strategic goals.
Let’s dive right in. Here are some of the important financial metrics that your business can track.
1. Revenue
Definition
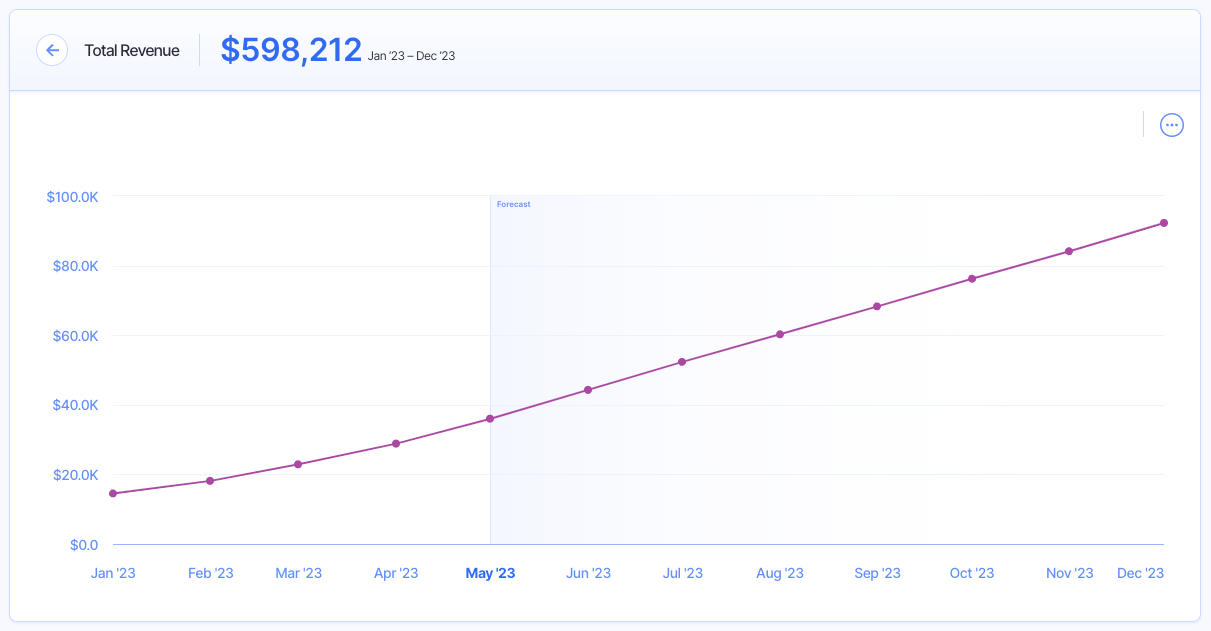
Revenue, or sales, is the total amount of money that your business generates during a given time from the sale of your products or services.
Formula
Price of Goods/Services * Quantity Sold
Why it’s important
Being able to generate sales is the driving force for any business.
Tracking this metric over time is a key indicator of whether your business is growing, stagnating, or on the decline.
While revenue is different from the profit your business actually retains, you can still gain a lot of insights by breaking down your revenue by different types (recurring or non-recurring) and looking at the product or service-specific sales levels.
2. Gross Margin
Definition
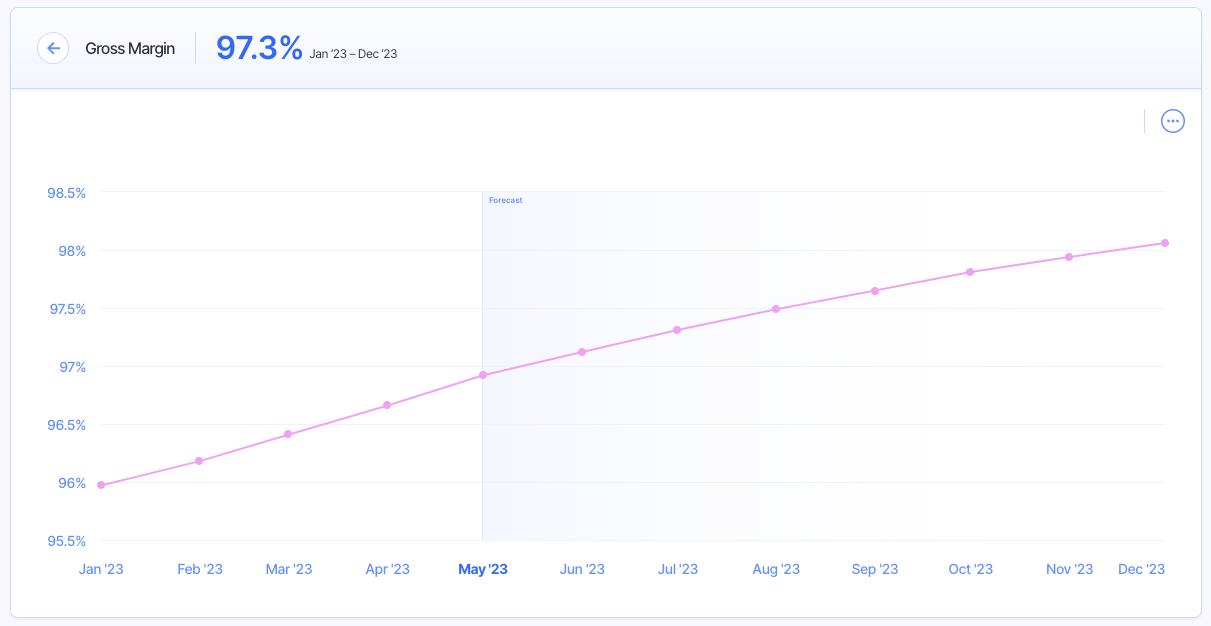
Gross margin is the percentage of revenue your business retains after accounting for the total cost it takes to produce your product or service.
Formula
(Revenue – Cost of Goods Sold)/Revenue
Why it’s important
Gross margin will tell you how well you are managing your resources, and is one of the financial metrics most important to investors.
It is a measure of your profitability that represents the amount of profit your company makes on each dollar generated from the sale of your goods or services.
A high gross margin means you are generating enough profit internally to fuel future growth opportunities. Plus, companies will generally see their gross margin increase over time as they grow.
But, a lower margin could mean that you need to adjust the price of your product or service to better cover the costs you incur to provide them.
3. Burn Rate
Definition
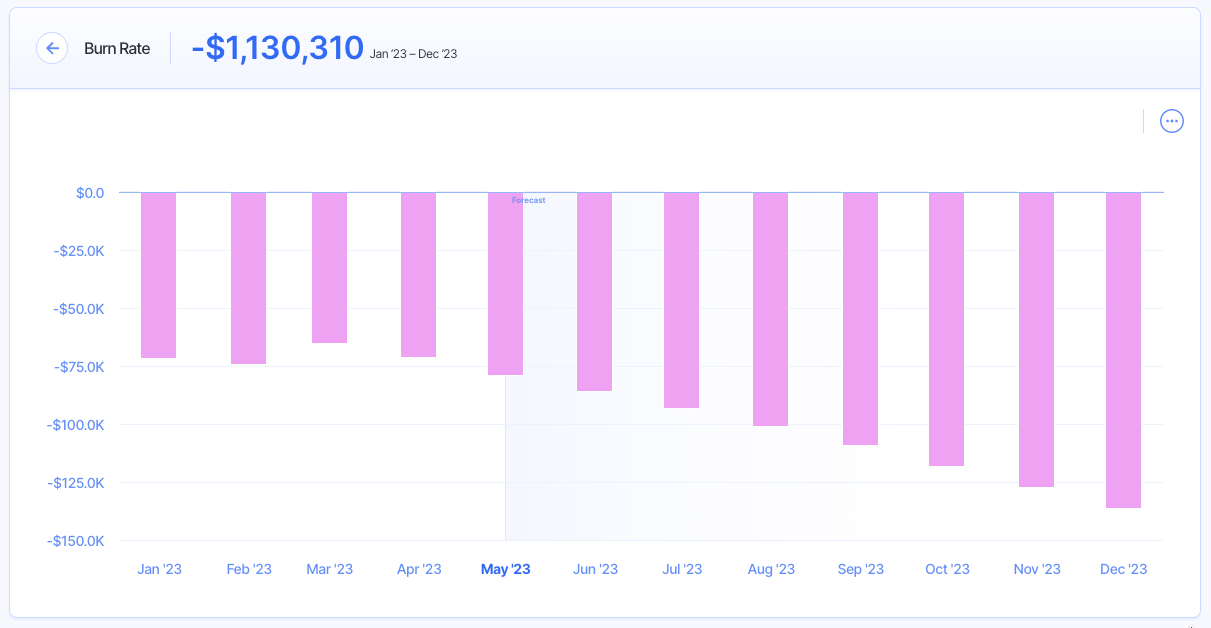
Burn rate measures the rate at which your company spends its cash to fund its operations.
Formula
Cash payments – cash collections
Why it’s important
Your burn rate will tell you how much cash your company is ‘burning’ through during a specific time period.
The higher the burn rate, the more quickly your company is spending its cash.
This can have important implications for the sustainability of your operations, and a consistently high burn rate may signal that you’ll need to secure outside financing to sustain your business.
4. Runway
Definition
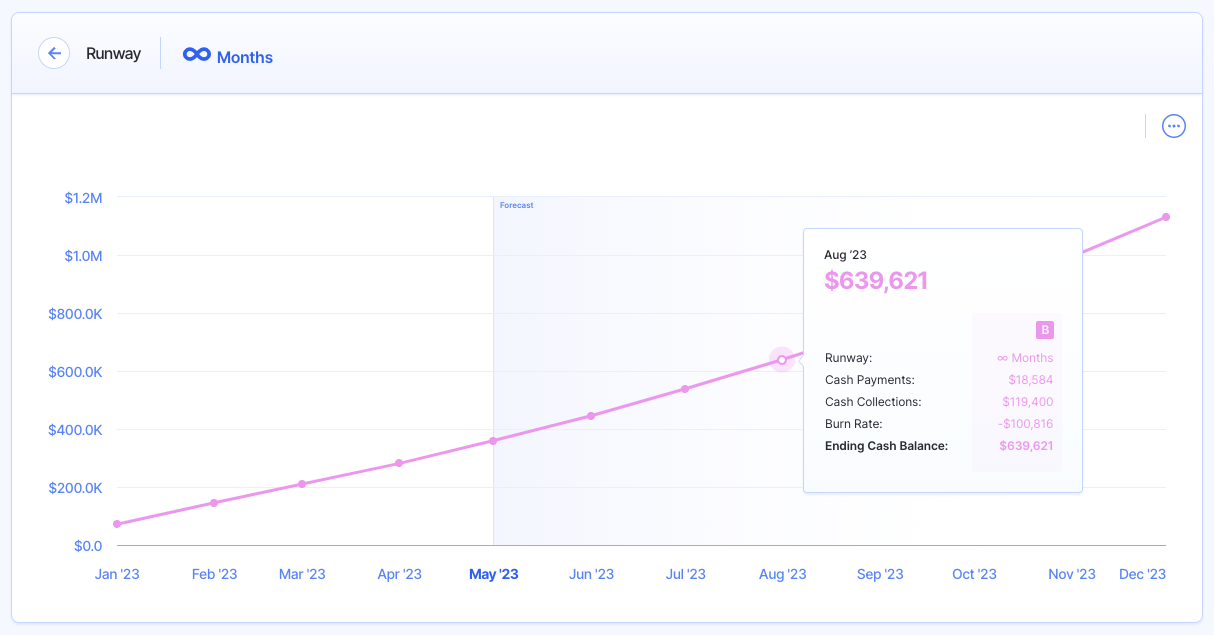
Runway (a.k.a cash runway) is how many months your business has before it runs out of cash.
Formula
Cash in Hand / Projected Burn Rate
Why it’s important
The longer your runway, the more time you have to build and grow your startup.
Your runway is determined by your revenue and expenses. If your monthly expenses are greater than your monthly revenue, you’re going to run out of cash eventually. Your runway tells you when “eventually” is.
Aside from the fact that your company literally needs runway to exist, this financial metric can also tell you a lot about your business.
5. Monthly Recurring Revenue (MRR)
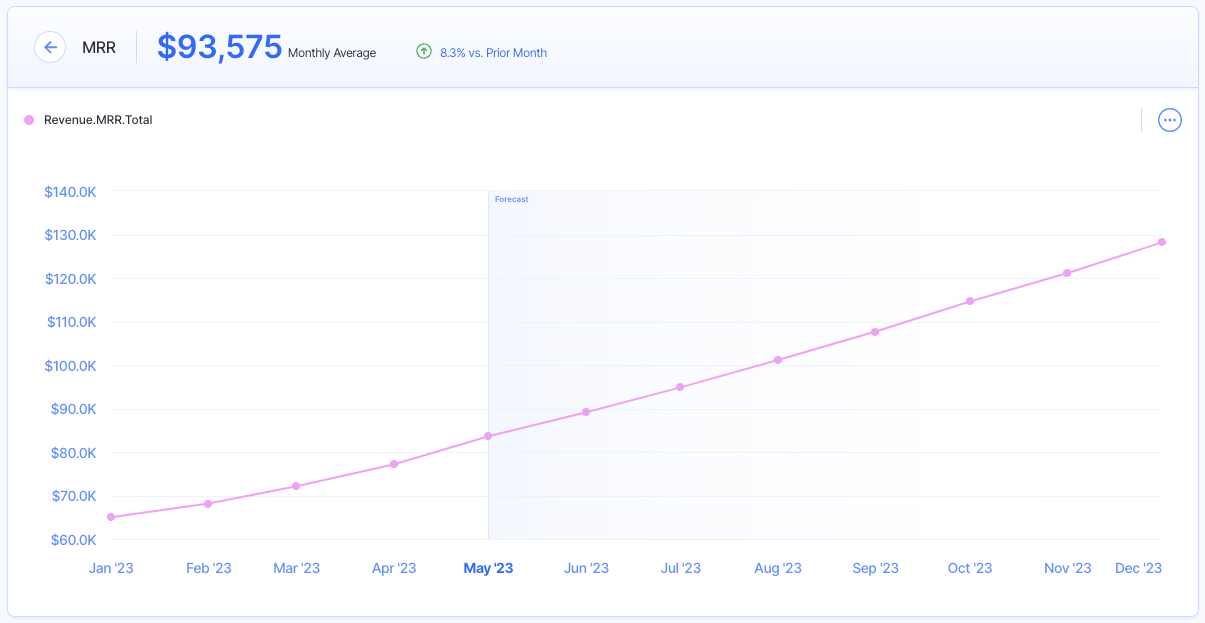
Definition
Monthly recurring revenue (MRR) is a financial metric for SaaS companies that represents the total amount of recurring revenue you generate from subscription customers each month.
Formula
Average Revenue per Account (Monthly) * Total # of Customers
Why it’s important
MRR gives subscription-based businesses a predictable measure of how much revenue you can expect to generate each month based on the monthly fee you charge your customers.
When taken into account with other metrics important to SaaS businesses like customer churn, potential growth, and other factors, MRR is a great tool to help you forecast future monthly revenue and make informed business decisions for the future.
6. Average Revenue Per Account (ARPA)
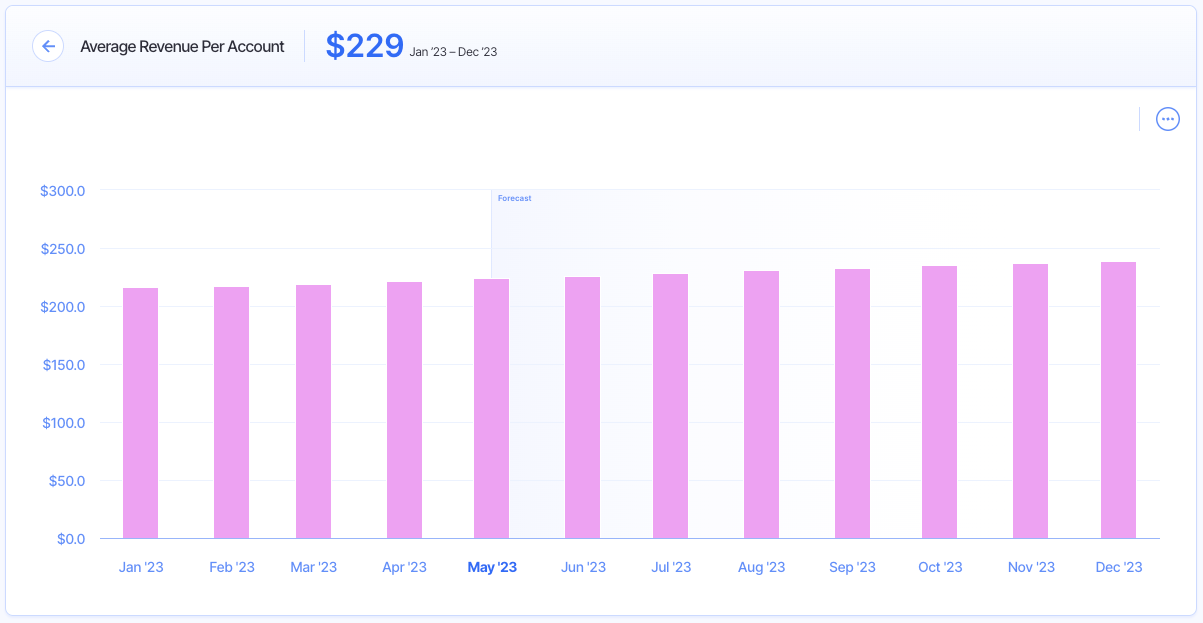
Definition
Average revenue per account (ARPA) is a metric that a SaaS business tracks to measure the average revenue you make per each paid account.
Formula
MRR / # of Total Accounts
Why it’s important
ARPA can provide you with a more granular understanding of your profitability and growth, and an objective way to compare yourself against industry peers.
You should not confuse this metric with average revenue per unit (ARPU), though the two are quite similar.
ARPA gives you insights into your pricing strategy, customer retention, and overall revenue growth. In general, an ARPA that is increasing shows that your sales and marketing efforts are proving effective.
By tracking this metric over time, you will start to notice monthly customer trends, which products drive the most revenue, and which level of subscription is most popular among your customers.
7. Customer Churn / Logo Churn
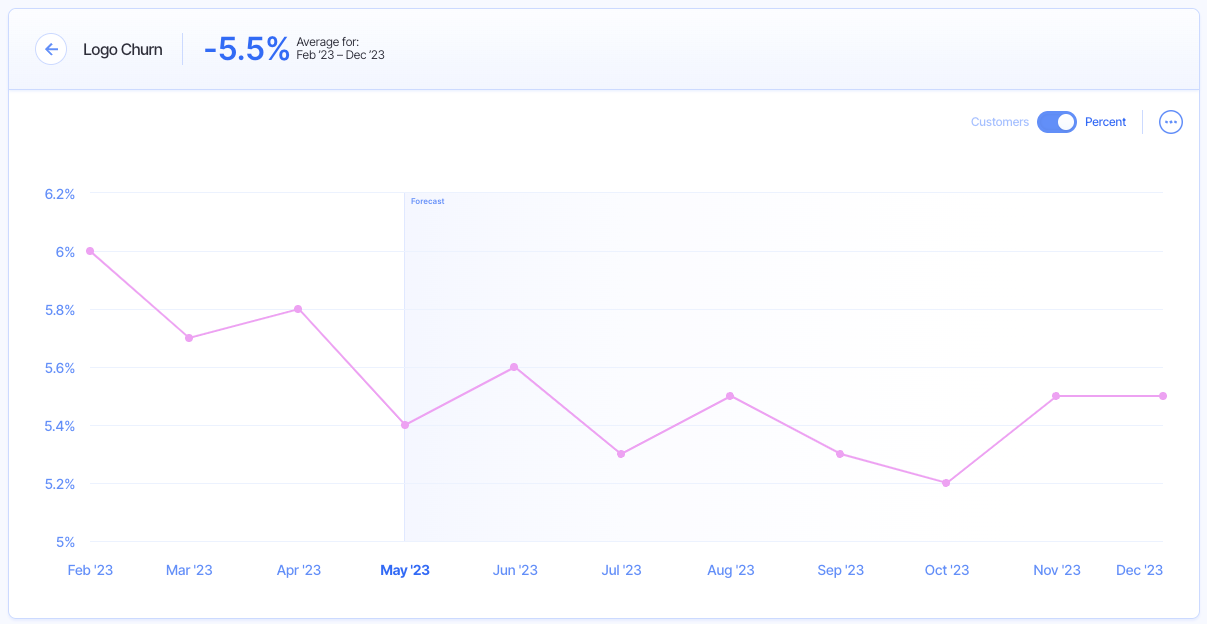
Definition
Customer churn (a.k.a. customer attrition or logo churn) is the percentage of customers your business lost during a set period of time.
Formula
(# of Churned Customers / Total # of Customers at the Beginning of the Period) * 100
Why it’s important
Every SaaS business will lose customers at some point, though you want to make sure you’re optimizing your churn rate and bringing in more customers than you lose for a given period.
The more customers you can retain, the lower your churn rate will be, which has positive implications for the long-term success of your business.
With a higher churn rate, you will have a harder time growing your business because you’ll constantly be chasing new customers to replace the churned ones before you can focus on growth.
8. MRR Churn
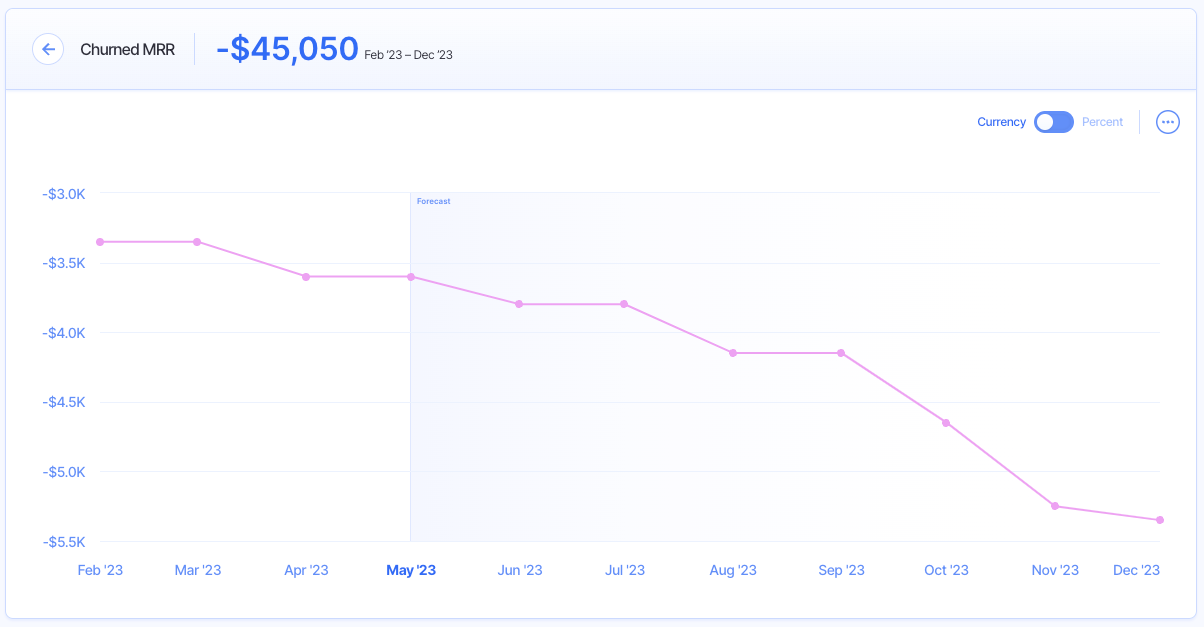
Definition
MRR churn is the amount of monthly recurring revenue you lose from existing customers.
Formula
Customers at the Beginning of the Month * Churn Rate * ARPA
Why it’s important
Just as it’s important for SaaS businesses to understand what your MRR is, you also need to know your MRR churn.
Again, any type of churn is inevitable for your business, though you need to have a good understanding of it in order to make informed business decisions.
MRR churn can help your financial planning efforts, as it can be used to predict your monthly revenue growth over time when accounting for lost customers. This will also give you better visibility on your cash runway.
9. Contraction MRR
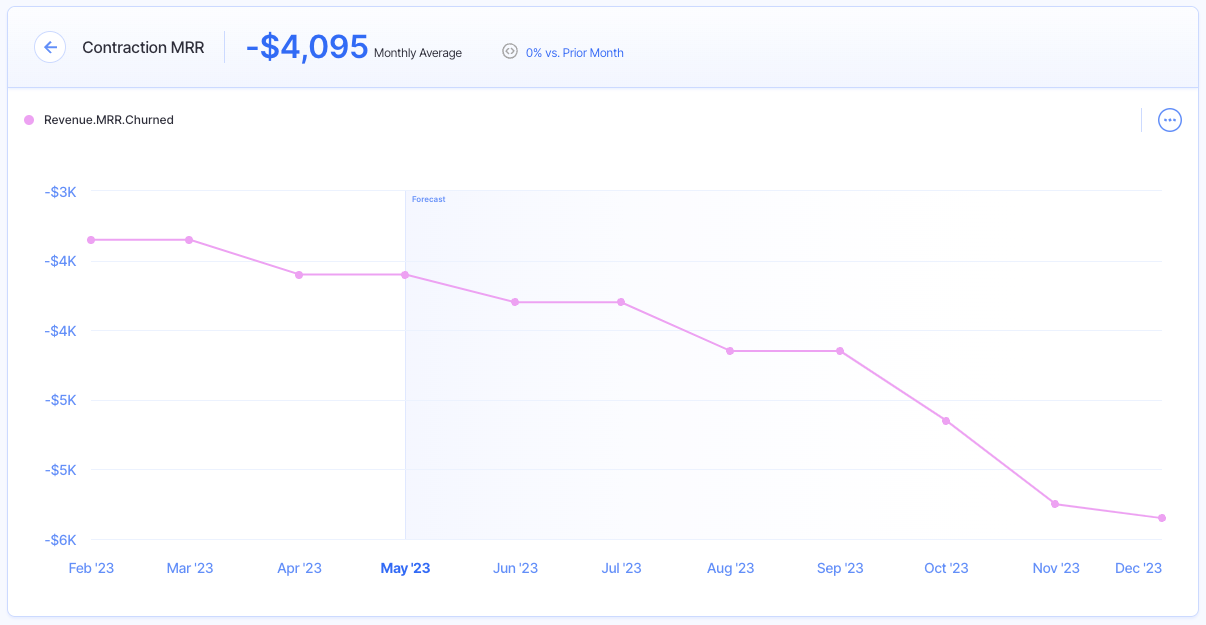
Definition
Contraction MRR is the total reduction in your MRR for a given month through subscription downgrades or churns.
Formula
Downgrade MRR + Churn MRR
Why it’s important
Customers will downgrade or cancel subscriptions each month, so it’s crucial to monitor and optimize this metric, even if it’s inevitable.
Knowing your contraction MRR alone is crucial, but you can also dive deeper into the metric to learn other insights like whether your product is priced too high in the market, if you’re not offering enough value, or not effectively conveying the value you provide.
Of course, you’d rather a customer downgrade than cancel altogether, so make sure you understand what’s driving your contraction MRR so you can promptly address any issues and support your growth objectives.
10. ARR
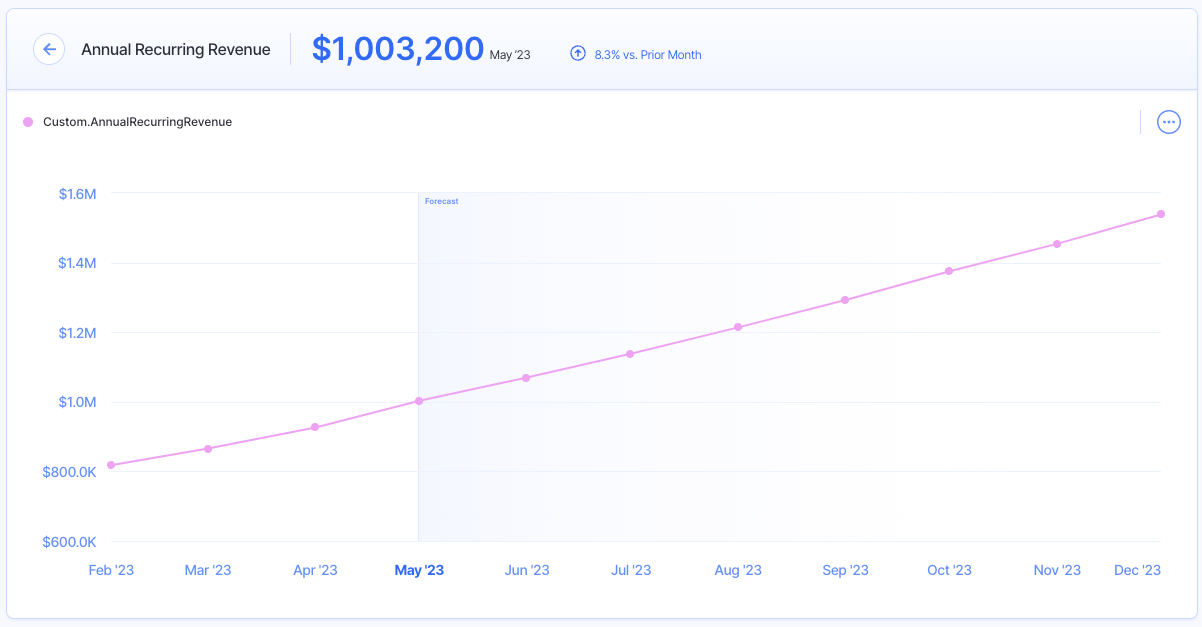
Definition
Annual recurring revenue is the amount of predictable revenue your company will generate from customers in a year.
Formula
MRR * 12
Why it’s important
The annualized version of MRR, ARR offers your business a lot of value when you run a subscription-based business.
If your business is unable to bring in a consistent flow of predictable revenue from your subscribing customers each year, your business will dry up.
Therefore, monitoring your ARR over time will help you create accurate revenue forecasts for your business, ensure you’re continuing to grow, and make informed decisions about the company’s budget.
11. Customer Acquisition Cost (CAC)
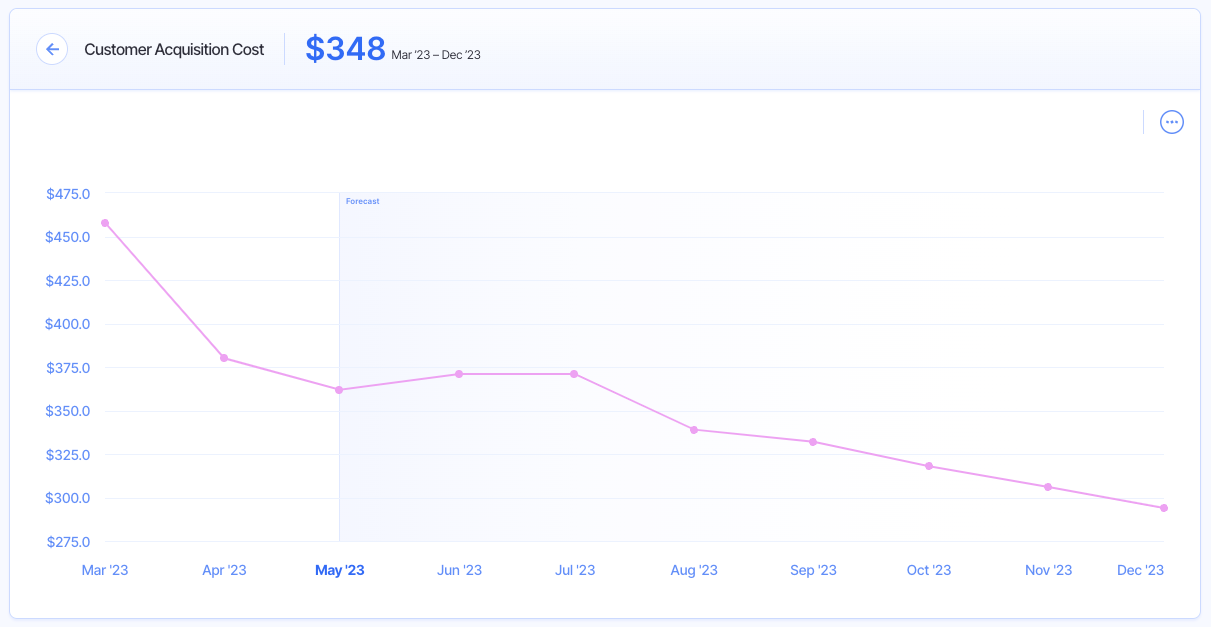
Definition
Customer acquisition cost (CAC) is the amount of money your company spends to acquire a new customer.
Formula
Sales & Marketing Expenses / # of New Customers Acquired
Why it’s important
Knowing how much your business needs to spend to attract a new customer is extremely valuable information.
Your CAC will tell you how effective your sales and marketing efforts are, and how much marketing spend you need to bring in a new sale.
Optimizing your CAC is an important job for the marketing department because spending too little can limit your growth potential while spending too much to acquire new customers can keep you from becoming profitable.
12. CAC Payback
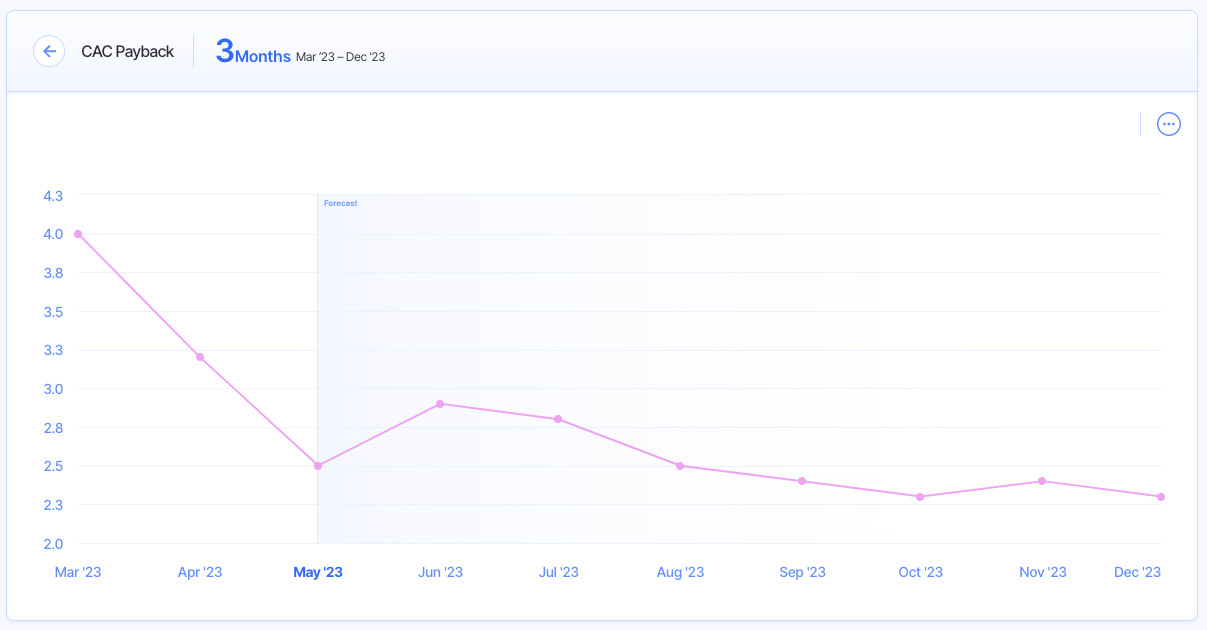
Definition
CAC payback (a.k.a. months to recover CAC) refers to the amount of time it takes for your business to earn back what it spent on customer acquisition costs.
Formula
Sales & Marketing Expenses / (New MRR * Gross Margin)
Why it’s important
The shorter the CAC payback period, the better, as this means you’re recovering (or ‘breaking even’) on your customer acquisition costs more quickly.
Understanding your CAC payback gives you a good idea of the type of ROI you’re generating from your sales and marketing efforts, and how effective they are overall.
Assessing your CAC payback period alongside other financial metrics like your LTV is important, as a low LTV and long CAC payback period could leave you insolvent if new customers churn before you fully recoup your customer acquisition costs.
13. Customer Lifetime Value (CLV)
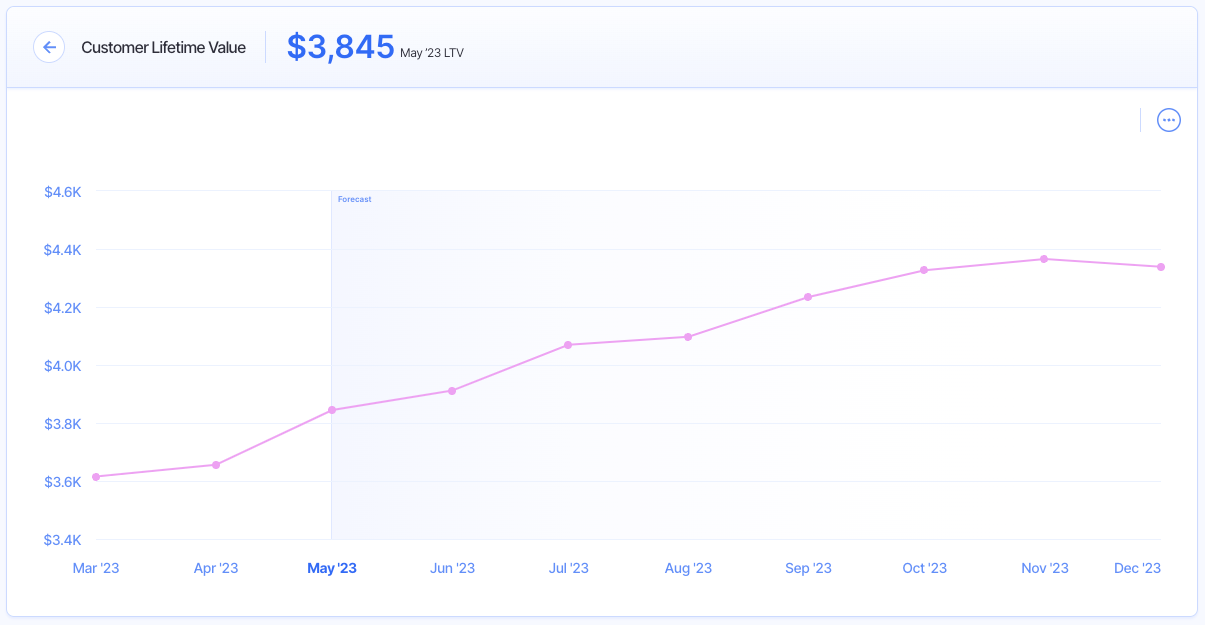
Definition
Customer lifetime value (CLV) is the average amount of revenue you can expect to collect from a customer before they churn.
Formula
(ARPA * Gross Margin) / Churn Rate
Why it’s important
Your customers are your lifeblood, so your LTV will tell you exactly how much each new customer is worth to your business over time.
You can learn a number of things about your customers from your LTV, including how long they stick around as customers, and how invested they are in your products.
So, optimizing this financial metric is multi-faceted, as you need to increase the amount of revenue customers spend with you, and keep them happy for as long as possible.
14. Customer Growth Percentage
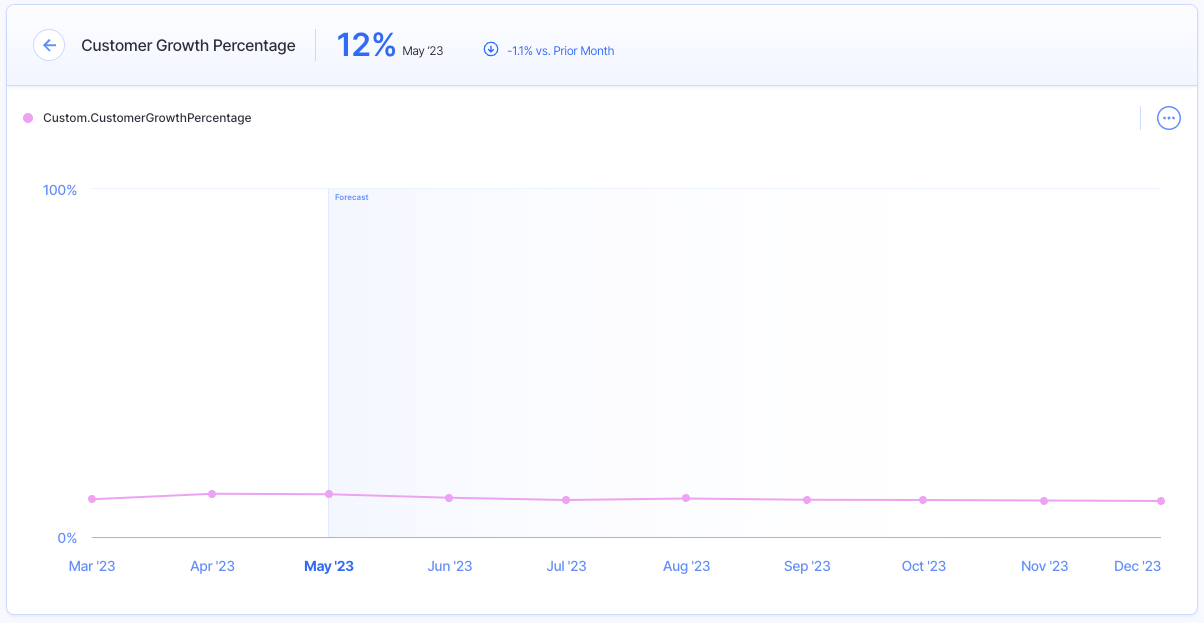
Definition
Customer growth percentage (a.k.a. New logo growth) is the number of new customers added in the current period relative to the total number of customers at the end of the previous period.
Formula
((New Customer this Period – New Customers Last Period) / New Customers Last Period) * 100
Why it’s important
This is an important indication of your ability to attract new customers and expand your market share.
Customer growth percentage is a great KPI to monitor if your company is a SaaS business, which typically relies on customer acquisition for business growth.
In most cases, a high new customer growth rate is a good sign and indicates that your sales and marketing efforts are effective at helping you acquire new customers and grow your operations.
But, you should also consider other factors like customer churn rates, customer lifetime value, and more to get a more comprehensive understanding of your business’s customer acquisition strategy.
15. LTV:CAC Ratio
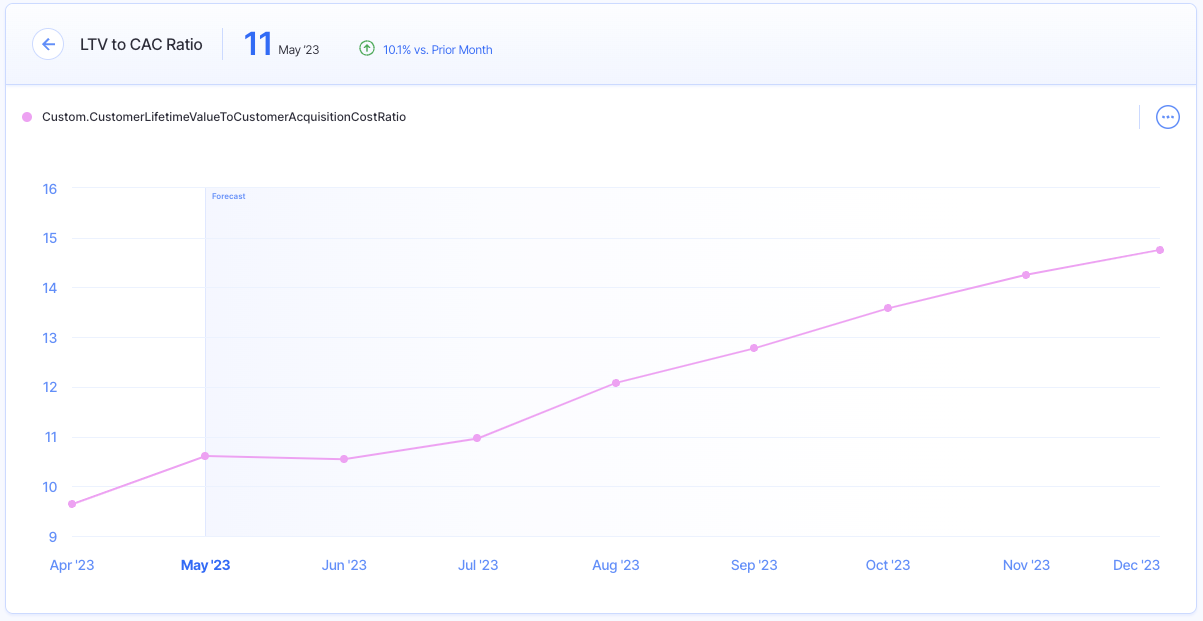
Definition
LTV:CAC ratio shows the relationship between your customer lifetime value and what you spend on customer acquisition costs.
Formula
Customer Lifetime Value / Customer Acquisition Cost
Why it’s important
Comparing LTV to CAC, you can get a good assessment of whether you’re spending too much on customer acquisition if the CAC exceeds the LTV, or not enough when the opposite is true.
Acquiring new customers costs money, but you also need to strike the right balance between the LTV and CAC to ensure your marketing efforts are sustainable for your business.
16. SaaS Quick Ratio
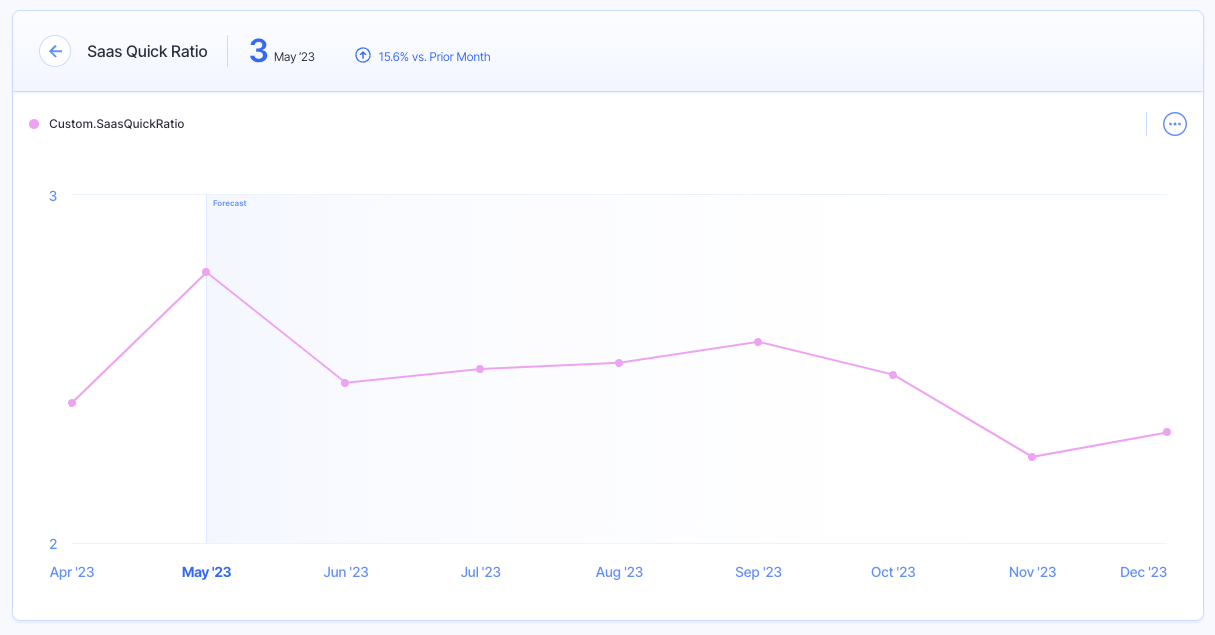
Definition
SaaS quick ratio is the relative amount of MRR added through new and expansion compared to the amount of MRR lost to contraction and churn.
Formula
(New MRR + Expansion MRR) / (Churn MRR + Contraction MRR)
Why it’s important
Seeing your MRR grow may seem like a universally good sign, though you need to consider this growth alongside the amount of MRR you’re losing to churn and contraction each month to ensure that it’s sustainable.
A good SaaS quick ratio is often considered to be 4 for early-stage companies, though this should be considered alongside the other financial metrics listed here to get a more comprehensive view of your business’s health.
17. SaaS Magic Number
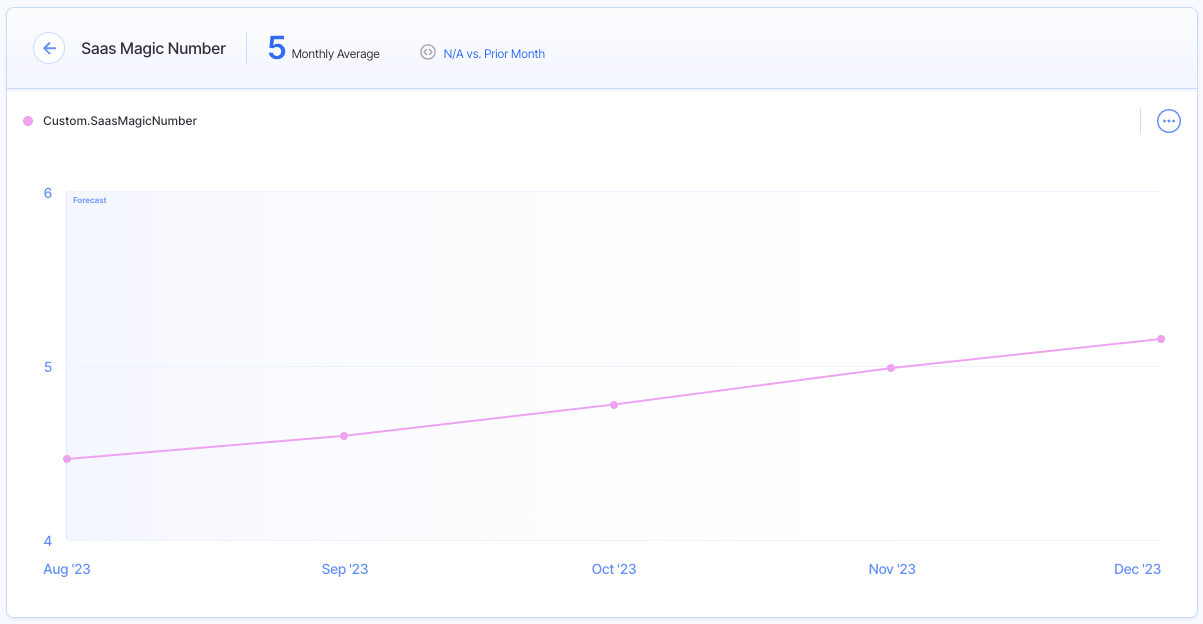
Definition
SaaS magic number is a measure of your company’s revenue growth against its customer acquisition costs.
Formula
(New MRR + Expansion MRR) / (Contraction MRR + Churned MRR)
Why it’s important
Your SaaS magic number can help you determine how much revenue growth you generate for every dollar spent on sales and marketing, and whether or not you’re overspending on customer acquisition.
A high magic number signals that your company generates significant revenue growth with little sales and marketing spend, which many investors will view as a good sign of the sustainability of your business.
18. Rule of 40
Definition
The Rule of 40 measures how well your business delivers on the combination of recurring revenue growth and profitability.
Formula
Revenue Growth Rate + Gross Margin
Why it’s important
This is a simple rule of thumb that many investors will use to calculate the financial health of your business, particularly if it’s a SaaS company.
The metric shows “good” performance when your company’s growth rate plus profitability is at or above 40. This means your company is growing at a healthy rate while still generating profits, which is generally a positive signal for investors.
If the sum of these two values is below 40, it could indicate that your company is experiencing high growth at low profitability, or good profitability but with slow growth.
While the Rule of 40 is not necessarily a comprehensive measure of your business’s financial health, it’s still important to know that investors may rely on it as a quick benchmark value.
19. Revenue Per Employee
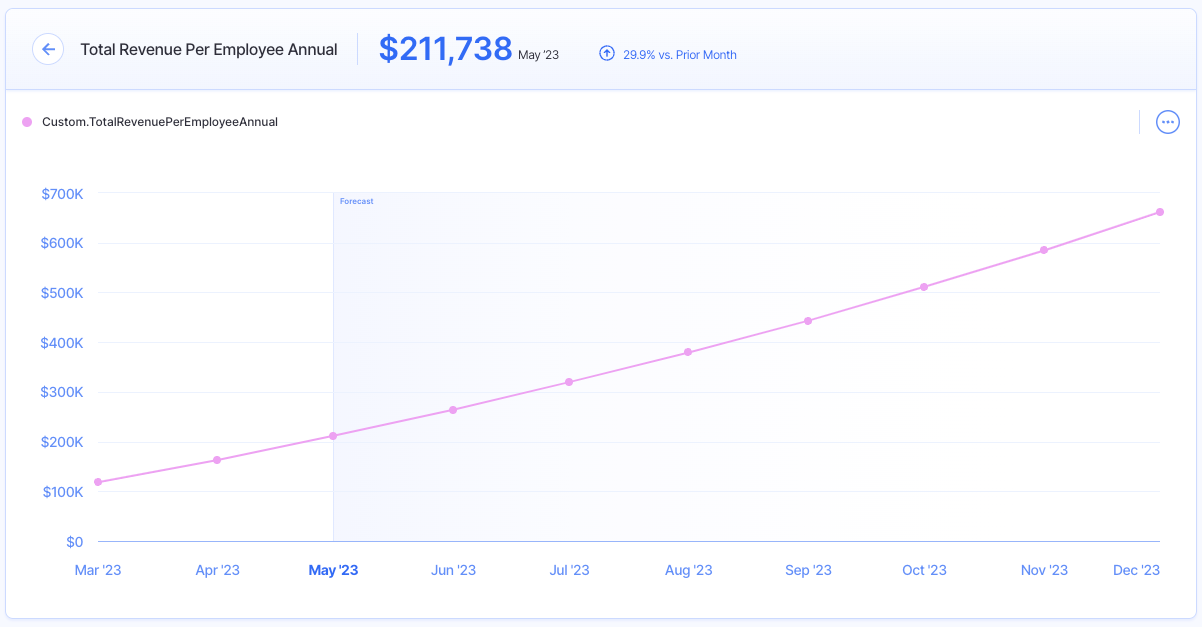
Definition
Revenue per employee shows the amount of revenue that each employee generates for your business.
Formula
TTM Total Company Revenue / Current # of Full-Time Employees
Why it’s important
Your employees are the life force for your operations, but they’re also a big expense for the business.
Revenue per employee gives you an objective way to measure the productivity of your team, though you may not rely on this value alone to make important business decisions.
When combined with other valuable financial metrics and compared against industry benchmarks, you can strategize future growth and ensure your team’s productivity will support these growth objectives.
20. Gross Revenue Retention
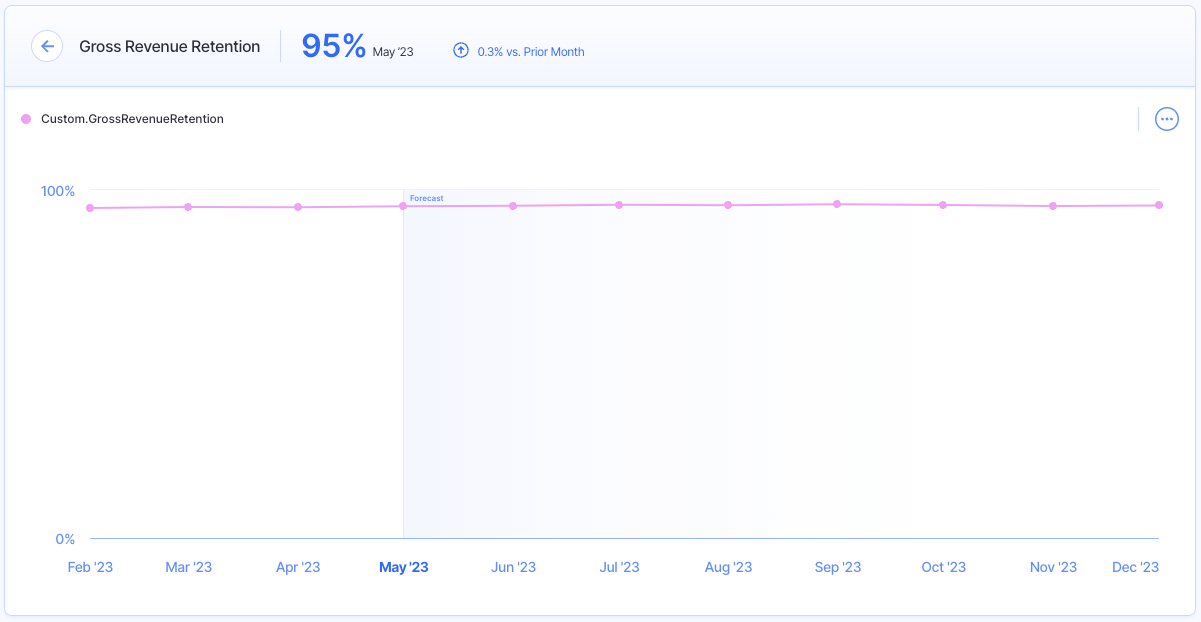
Definition
Gross revenue retention is the percentage of your revenue that is retained over a given period of time.
Formula
1 – [(Churned MRR + Downgrade MRR) / MRR at the End of the Previous Month]
Why it’s important
For a growing SaaS business, monitoring your gross revenue retention is a key aspect of measuring your customers’ satisfaction with your products or services.
Over time, you’ll want to watch your gross revenue retention rate increase, which signals that you’re dedicated to your customers and have a good product/market fit.
When assessed in conjunction with other financial metrics like CAC and LTV, you can get a good read of your profitability, as a higher revenue retention rate means you’re supporting sales with the customers you’ve already paid to acquire.
Track Your Financial Metrics Like a Pro with Finmark From BILL
Tracking the above financial metrics is something that each business should do. In doing so, you can provide yourself with accurate data to make informed business decisions, as well as present your performance in an objective manner to external stakeholders and financial professionals.
While the individual metrics and KPIs you choose to track may differ based on your specific business and the industry you operate in, the metrics listed throughout this guide give you an excellent starting point to gain better visibility into your business’s performance.
When you use an intuitive financial management tool like Finmark from BILL, you can easily track and forecast these metrics with custom dashboards that are tailored to your needs. We have a library of out-of-the-box metrics and KPIs that you can choose from, offering you a seamless way to monitor your performance with one tool.
Try Finmark for free to see how we can transform how you track your financial metrics.
Contributor
This content is presented “as is,” and is not intended to provide tax, legal or financial advice. Please consult your advisor with any questions.