Cash Flow vs. Free Cash Flow: What’s The Difference?

Cash flow is one of the most important metrics to track for small businesses. However, did you know there are a few different ways to analyze cash flow?
While most business owners are familiar with net cash flow (cash in – cash out), there’s another metric commonly used by investors to assess cash flow that you may not be as familiar with—free cash flow (FCF).
Curious about what FCF is and how it differs from net cash flow? Read on as we do a deep dive into cash flow vs free cash flow and break down why both are important in assessing the financial health of your business.
What Is Cash Flow?
Cash flow measures how much cash your business used or generated over a certain period. It’s the net of all the cash inflows and outflows that occurred during the month, quarter, year, etc.
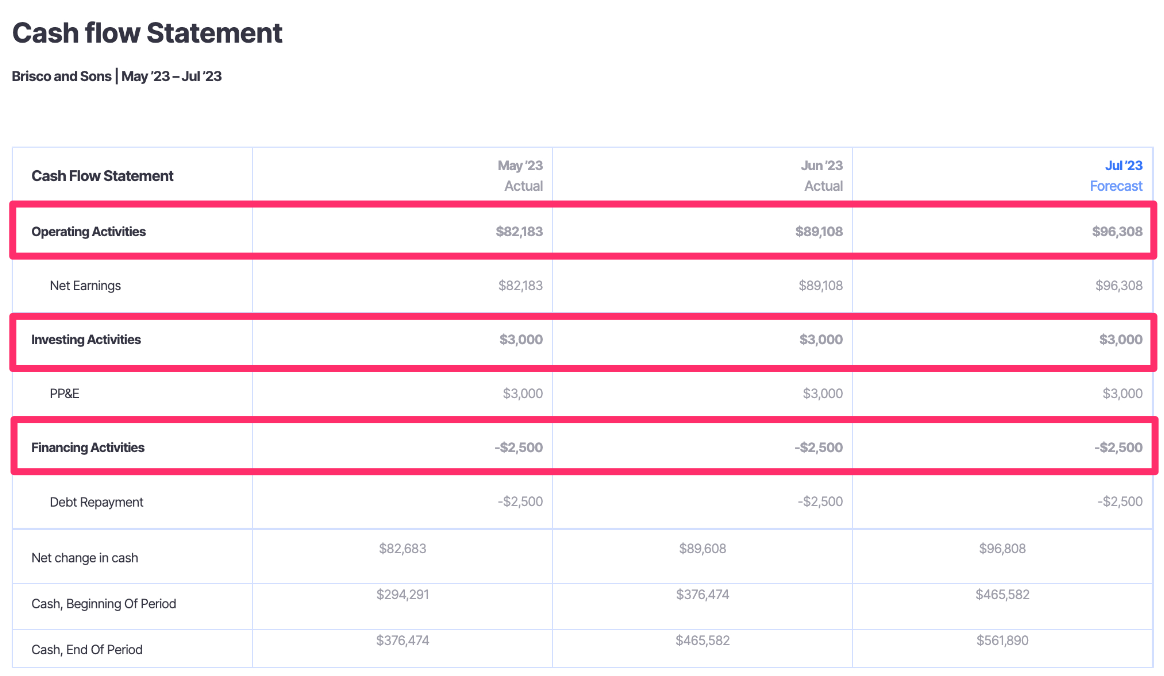
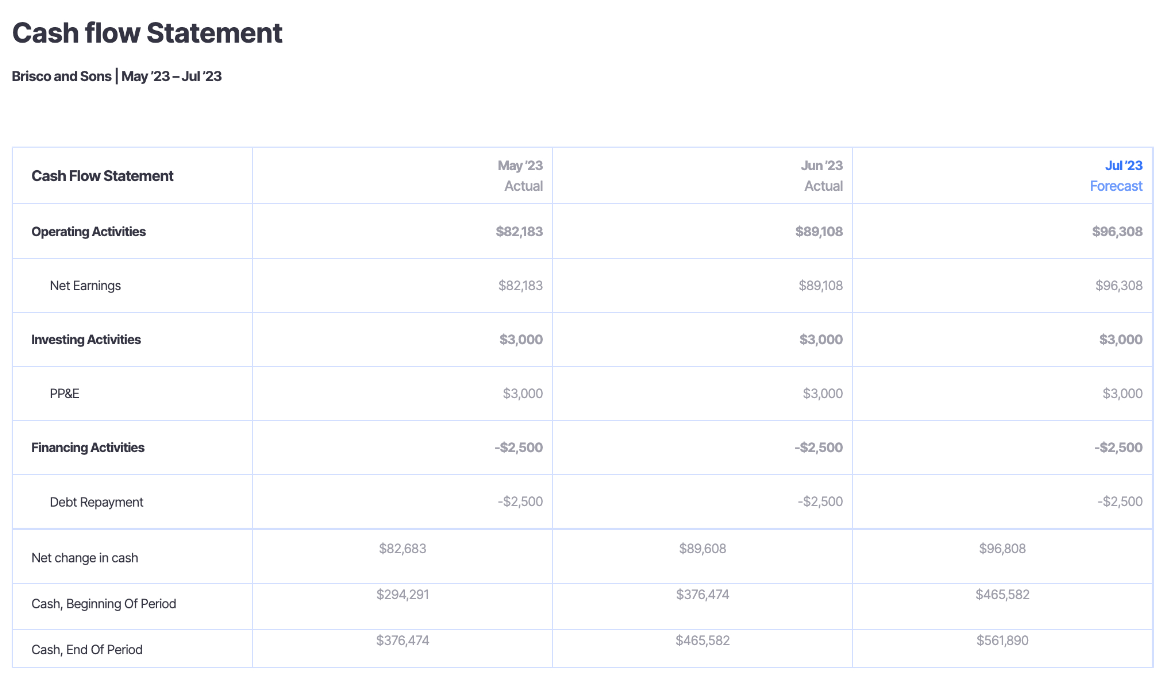
This figure is reported on the cash flow statement, which tracks net cash flow in three distinct categories:
- Net cash flow from operating activities
- Net cash flow from investing activities
- Net cash flow from financing activities
Combining each of these values gives you the total net cash flow for the business during the period.
If your net cash flow is positive, the business ended with more cash than it started with, and vice versa if the cash flow is negative.
Cash Flow Formula
There are two ways to calculate the net cash flow on a cash flow statement:
Both methods result in the same cash flow figure, so choosing which option to use often comes down to the preferences of your team.
However, the indirect method tends to be the more popular choice since it’s more straightforward and scalable for a growing company.
Here is a general formula for calculating cash flow:
(Cash Inflows from Operations – Cash Outflows from Operations)
+
(Cash Inflows from Investing – Cash Outflows from Investing)
+
(Cash Inflows from Financing – Cash Outflows from Financing)
=
Cash Flow
You can calculate cash flow by hand using this formula. But, it’s much easier to use a tool like Finmark by BILL to see your cash flow figure in real-time using current financial data.
You can quickly compare current cash flow against historical performance in Finmark to uncover improvement opportunities and make informed financial planning decisions.
What Cash Flow Tells You
As we have mentioned, monitoring your cash flow will help you determine how much cash you actually brought into the business during a given period of time.
In this sense, it can help show you how efficiently you’re managing the cash that’s coming into the business.
Cash flow is often compared to net income as an indicator of financial performance over a period.
However, the accrual accounting principles that are used to calculate net income include certain non-cash items like depreciation and amortization expense, meaning they didn’t actually result in a cash outflow during the period.
As such, the cash flow figure is seen as an objective measure of whether the cash inflows were larger than the cash outflows made over the period.
Investors, business leaders, creditors, and other stakeholders may assess the cash flow value as a way to determine if the business is self-sustaining. It can show whether the business is able to meet its short-term obligations with the cash on hand.
What Is Free Cash Flow (FCF)?
Free cash flow (FCF) refers to the cash a company generates from operating activities, after accounting for cash that was paid for operating expenses and capital expenditures.
Put differently, the free cash flow figure shows how much money is left for investors after the company takes care of its operations, but before they make dividend payments, debt payments, or share repurchases.
Free Cash Flow Formula
This figure shows a company’s ability to generate cash beyond what it needs to support operating and investing activities.
The simple formula used to calculate free cash flow is as follows:
(Cash Flow from Operations – Capital Expenditures)
=
Free Cash Flow
In this case, the cash flow from operations is the same figure that is used to calculate the business’s total cash flow, as seen above. It refers to the cash that is generated from the business’s core operations.
Capital expenditures are the investments that the company makes in fixed assets like property, plant, and equipment, or on long-term projects.
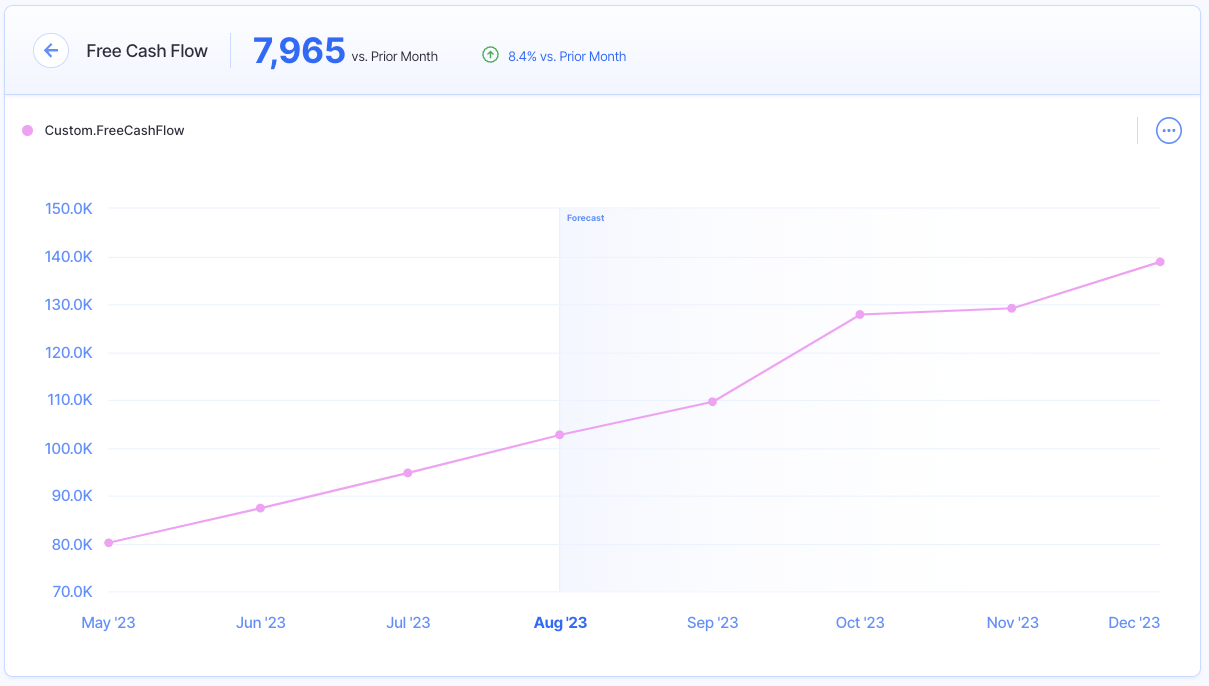
Just like with cash flow, using Finmark to calculate your free cash flow is quick and simple.
With our user-friendly interface, you can see your current free cash flow using real-time financial data.
You can seamlessly compare free cash flow against other figures like your total cash flow for a deeper analysis of your cash management.
What Free Cash Flow Tells You
Free cash flow is a common figure that investors will analyze to see if a business is a worthwhile investment.
Thus, your internal team will be interested in monitoring your free cash flow value largely because of the importance that potential investors put on this metric.
Using free cash flow, investors can see if the company has enough cash on hand to repay creditors and equity investors after paying for its operating expenses and capital expenditures.
Further, free cash flow is a major component of a discounted cash flow (DCF) method of valuating a business as an investment prospect.
Analyzing free cash flow helps investors compare different companies to determine which is the more attractive investment.
A higher free cash flow value is generally seen as a good thing for investors.
A negative free cash flow would mean the company isn’t generating enough from its operating activities to fund its capital expenditures, nonetheless return capital to its investors.
Comparing Cash Flow vs. Free Cash Flow
Cash flow is seen as a straightforward measure of the net cash that came into or left the business during a given period of time.
Free cash flow is a figure that tells investors how much cash your business has on hand after funding its operating and investing needs. This free cash flow can be used for:
- Share buybacks
- Dividend payments
- Debt payments
As you can see from the two formulas, the overlap between cash flow and free cash flow is the operating cash flow figure, or how much cash the business generates from its core operations.
So, the two figures are highly correlated. You can assume that the higher your cash flow figure, the higher the free cash flow will be.
Both cash flow and free cash flow can reflect the financial performance of the business over a given period, and how effectively you are managing cash.
But, comparing cash flow vs free cash flow can give investors more visibility into:
- What the sources of cash are
- Where the company is spending capital
- What the company is investing in
Analyzing both figures together gives a clearer picture of how much cash your company brings in from core operations and what this cash is being used for.
Example of Cash Flow vs. Free Cash Flow
Let’s assume your business has a sizable cash balance. If you’re seeking out investors, you may assume that this is a positive indicator of your financial health.
However, upon deeper inspection of the company’s cash flow and free cash flow figures, investors may see that the capital is coming from the debt you have issued, not your regular operations, as seen calculated below.
|
|
As a result, your cash flow figure would look quite healthy given the cash inflow that occurred in the financing section from the debt issuance.
But, this would not be reflected in the free cash flow calculation since it is only focused on the operating section and capital expenditures.
Thus, the cash flow figure is more than double the free cash flow amount, which may impact how investors view the viability of the company.
Investors want to know that they’ll be able to benefit from share repurchases, dividend payments, or capital that you’re putting back into the business to make their investment more valuable.
In this case, they may assume that the free cash flow you do generate will need to go to debt repayments for the time being, not returned to them as dividends or plowed back into the business.
So, investors want to see that you’re generating enough cash flow as a baseline. But, they also want to see how your investments into fixed assets and other debt payments will impact their ability to recoup their capital.
Wrapping up Our Comparison of Cash Flow vs. Free Cash Flow
Many investors will monitor your cash flow and free cash flow levels over time to see how sustainable they are, and whether or not the company would be a reliable investment.
So if you are closely monitoring your cash flows to make financial planning decisions and ensure you’ll meet your short-term obligations, don’t overlook your free cash flow value.
Both metrics are helpful in determining where your cash is coming from, and how effectively you’re using it.
When you use an intuitive financial planning tool like Finmark, keeping track of both of these metrics is simple and straightforward. You can quickly calculate your real-time cash flow and free cash flow to gain a real-time view of your financial position.
Get started with Finmark for free for 30 days to streamline your financial analysis and planning, and get a better handle on your cash management.
Contributor
This content is presented “as is,” and is not intended to provide tax, legal or financial advice. Please consult your advisor with any questions.


