8 Tips to Make Financial Presentations (Without Being Boring)

Some people are numbers people. They go into jobs like accounting and finance, and, if they’re really good, become CFOs.
But most people aren’t.
For most of us, pages and pages of financial data are more likely to put us to sleep than to motivate us for the upcoming quarter.
But financial information still needs to be presented to investors, the board, senior leadership, and the company as a whole.
That’s because behind those walls of numbers lies a story that explains your company’s success (or otherwise) and the reasons for it.
As someone charged with delivering a financial presentation, your job is to extract that story and communicate it in a way that resonates with the audience to whom you’re presenting.
No pressure.
In this guide, we’re going to cover eight best practices for creating and delivering financial presentations, so you can maximize engagement and get everyone as excited as you are about the numbers.
1. Know Your Audience
Like any good lesson in communications, our first piece of advice is to remember who you’re talking to when preparing a financial presentation.
If you’re a CFO presenting the rest of the C-Suite, then you’ll want to bear in mind the goals and desires of each member.
The CEO wants to know what financial performance means for business progress, and the COO wants to know how to put that information into plans for action, for instance.
But, if you’re a founder pitching to investors, then you have a very different audience. They’re interested in growth trajectories, potential, and your ability to understand financial risks.
Your audience dictates not only the content of your financial presentation, but the form as well.
For investors, you can probably go a little deeper on the numbers, as it’s something they are intently interested in. If you are holding an annual presentation to your entire company, on the other hand, you’ll want to focus more on what the numbers mean at the departmental level.
Before preparing your financial presentation, answer three questions to get your framing right:
- Who will I be presenting to?
- What goals and interests do they have?
- How is the information I have to present relevant to those goals or interests?
2. Go Heavy On Simple Visuals
A good financial presentation is heavy on visuals.
Colorful graphs and charts don’t just look pretty; they communicate information much more rapidly and make it more accessible to those who aren’t so good with numbers and tables.
But all visuals aren’t made equal, and graphs can quickly become too complex to be useful:

Stay away from complex graph types and lean toward the simple and familiar options:
- Bar chart
- Line graph
- Pie chart
Make use of color to draw attention to the point you’re trying to make. Red and green are universal for signaling good vs. bad.

For example, you might color months of growth green and decline red, or take the same approach for budget overs and unders.
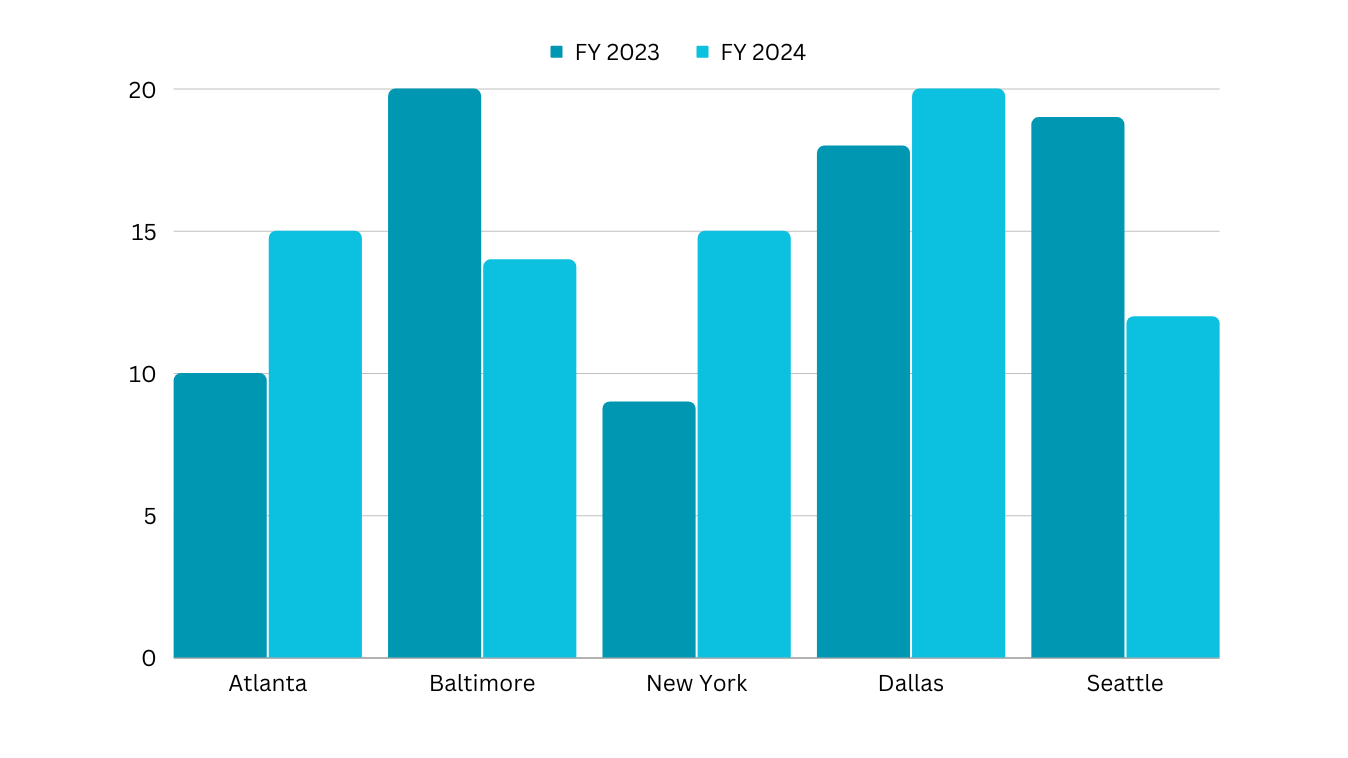
You can also use different degrees of shading to draw attention to specific points. For example, if you’re comparing this year’s performance to previous, a darker shade can be used to highlight the more important or recent figures.
Try not to present more than one or two visuals per slide. This will help prevent your audience from getting distracted and improve your ability to command attention.
3. Let Your Audience Know What To Expect Up Front
The beginning of your presentation should clearly outline what you’re going to discuss.
This primes your audience to absorb specific information, rather than expending additional mental energy to determine the plot.
Your presentation shouldn’t be a murder mystery.
In the first slide, briefly note what your presentation is going to focus on. For instance:
We’re going to look through last month’s profit figures. We’ll cover:
- Revenue streams
- Expense lines
- How performance compared to expectation
- Forecasts and recommendations for moving forward
4. Find The Story Your Numbers Tell
This is really the crux of a great financial presentation.
Your job as a finance leader is not just to say what happened—this can be achieved using automated bookkeeping software and financial reporting tools.
To add value, your job is to explain what these numbers mean.
Let’s say you’re celebrating a successful year, where you closed $2.5m in revenue, $500k above target.
It’s not enough just to point this out. You should:
- Explore what was behind your success
- Identify how your team can replicate those behaviors to create further success
- Explain the implications of that success on business growth
- Make recommendations for moving forward
5. Only Dive Deep Where It’s Necessary
This one’s a pretty simple rule:
Only present the information you need.
If you’re presenting to the C-Suite, you don’t need to detail every line item on the P&L. Instead, you’ll focus on the most important top-line numbers.
That doesn’t mean you can’t go deep, but save it for the conversations that matter.
Say, for example, you’re presenting last quarter’s numbers, where you didn’t hit your profit targets despite revenue being above budget. This is where you can explore in a little more detail, examining which expenses blew out, and why.
With the goal of keeping your financial presentation concise in mind, a good tactic can be to organize takeaways that go into further detail.
You can email them out to participants after the presentation, allowing those who want to dive deep to do so.
6. Keep A Narrative Thread Between Slides
Keep your audience engaged by ensuring there is a single story that unites all of your slides, graphs, and figures.
Basically, your presentation should have a “point,” and everything you discuss within it should be relevant to that point.
Even something as routine as a quarterly exploration of performance can have a point (Did you meet, exceed, or fall short of expectations?).
If, for example, the point of the presentation is that you didn’t hit your profit numbers for the quarter, then each slide should explore a different aspect of why (revenue sources, expenses, market fluctuations, etc.)
7. Use Your Slides To Support Your Points, Not Repeat Them
Your slides shouldn’t say the same thing as you are, nor should you read off of your slides as if they are your notes.
The point of slides in a presentation is to supplement the narrative you’re giving using imagery.
For instance, say you’re presenting revenue figures for the previous financial year. Your slide for this point should display a graph that stacks different revenue sources up against each other.
Then, you’ll talk through reasons that led to revenue being above or below forecast for each source, changes that occurred throughout the course of the year, and what this means for your company moving forward (as well as your recommendations for strategic changes).
You might supplement that last point with a second graph that forecasts revenue for the upcoming year if the company follows the recommendations you just gave.
8. Sign Off With A Summary Of Important Takeaways
Finish your financial presentation with a quick summary of the important points.
It might feel like you’re treading on ground you’ve already covered, but you should bear in mind that you’ve spent hours poring over this data, but its the first time your audience has heard it.
For those who aren’t as number-savvy as you are, sitting through a financial presentation can be mentally draining, and absorbing a ton of figures (even if you’ve presented them succinctly and effectively) can be difficult.
Make life easy for your audience by recapping the important points. For example:
In summary:
- Total revenue was $1.2m, $100k below budget
- Total expenses were $600k, on budget
- Forecast for the rest of the year puts us $400k below budget
- We can right the ship by reallocating some of our advertising funds to an outbound sales initiative
Create Engaging Financial Presentations With Finmarl
Creating engaging financial presentations doesn’t have to be the headache you think it is.
With a strong focus on presenting story over numbers, and by consistently reminding yourself to serve your audience, you’ll soon be creating financial presentations that educate and inspire on the regular.
Of course, you’ll need more than a few helpful visuals to illustrate the points you’re trying to make in a way that everyone understands them.
Luckily, you don’t have to be a Canva wizard to get your financial visuals sorted. Just export your reports from Finmark from BILL.

Wait, you’re not using Finmark to manage financial strategies, model scenarios, and make plans for fundraising, hiring, and capital investment?
Guess you’d better head here then, and get started with a 30-day free trial of Finmark.
Contributor
This content is presented “as is,” and is not intended to provide tax, legal or financial advice. Please consult your advisor with any questions.