How to Create Financial Projections For Your Business (Accurately)

Whether you’re starting a new business or making plans for an existing one, creating financial projections will give you a significant advantage.
For a new business, financial projections can help you:
- Determine whether or not your business is financially feasible
- Figure out how much cash you need to sustain the business
- Create revenue and expense projections
Not only that, but if you’re seeking outside funding (e.g. loans or fundraising) the people giving you money will expect to see financial projections in your business plan.
For an existing business, your projections can help you:
- Forecast changes in your revenue and expenses
- Re-evaluate your current and future growth plans
- Decide if and when you need to fundraise
But where exactly do you start?
In this guide, we’ll break down everything you need to know about creating financial projections. From what to include, how to create one, and what steps to take based on your projections.
What is a Financial Projection?
A financial projection is a forecast of how much revenue you expect to generate and what your expenses will be, broken down month by month.
Your financial projection should answer these three questions:
- What does the financial future of your business look like?
- How much cash will flow in and out of your business?
- Where will that cash come from and how will you use it?
Here’s where things get a little tricky.
When someone asks you for financial projections, they could be asking for a number of different things.
For some people, they just want to see your profit and loss statement (P&L) forecast. Others will want to see cash flow projections.
To cover yourself, we suggest having projections for all three financial statements handy.
Don’t worry, I’ll show you how to condense this and make it easy for anyone to access the parts they’re most interested in.
When Do You Need to Create Financial Projections?
Financial projections aren’t something you typically do spur of the moment. It’s usually done in preparation for something else.
Here are some of the most common reasons to create financial projections for your business:
Fundraising
No matter how great your idea may be or how compelling your story is, most investors want to see the numbers behind it. Financial projections are the most common way to present financial information to investors.
Getting a loan
If you’re applying for a business loan with a bank or other financial institution, they’ll likely want to see financial projections in your business plan.
Banks are generally more risk-averse than investors. Your projections can go a long way towards making lenders feel secure in lending your business money.
Budgeting
Financial projections can have significant implications on your annual budget. A positive projection might make you feel more comfortable increasing your expenses to fund growth.
A less favorable projection may cause you to pull back a bit and be more conservative with hiring, marketing costs, and other expenses.
Making Growth Plans
One of the most important reasons to do a financial projection is to figure out whether or not your business will be financially viable in the short, mid, and long term.
Taking the time to project revenue, expenses, and cash flow will show you what your financials will look like within a specific period of time.
What to Include in Your Financial Projection
Financial projections typically include several pieces of information that are organized into three financial statements:
- P&L or income statement
- Cash flow projection
- Balance sheet
Now, let’s dive deeper into all the parts of your projection.
Revenue
Without revenue, you don’t have a business.
Your projection should answer the question: How much revenue will your business generate in the next 6, 12, or 18 months?
Your revenue projections help you understand how much you expect to sell and how much money you’ll have to spend on operating and growing the business.
Cost of Goods Sold (COGS)
It takes money to make money. Your cost of goods sold (also known as cost of sales) projections will help you understand how much it’s going to cost you to produce your product or service.
If you’re selling physical goods, for instance, your production costs will likely increase in relation to your sales since you need to buy materials or products in order to sell your goods.
Expenses
In addition to your COGS, you’ll also have other operating expenses that go along with running and growing your business.
Software, equipment, sales and marketing, accounting services, legal fees, and all the other costs of doing business need to be included in your expense projections.
Payroll
Payroll is one of the largest expenses for most startups.
Not only should you project payroll as a whole (i.e. we expect to spend “X” amount in salaries per month), but you can also break it down by department.
For instance, you can project how much you expect to spend on salaries for sales, engineering, customer service, marketing, and all of your other teams.

| Note: You can (and should) present your revenue, COGS, expenses, and payroll projections in a P&L statement. Finmark makes it easy to create your P&L forecast without having to use spreadsheets and calculations. |
Cash Flow Projections
In addition to laying out your revenue and expenses, you should also include a cash flow projection.
A cash flow projection (also known as a cash flow forecast) is a monthly breakdown of:
- Accounts receivable: Cash you expect to collect. This includes the revenue from sales and any other forms of incoming cash.
- Accounts payable: Cash you expect to pay out. This includes things like the expenses we mentioned above like payroll, office rent, and supplies. It also includes other costs like loan repayments and taxes.
You subtract your accounts payable from your accounts receivable to get your monthly cash balance.
That cash balance gets carried over to the next month and added to your cash balance.
Here’s an example of what a cash flow projection might look like.
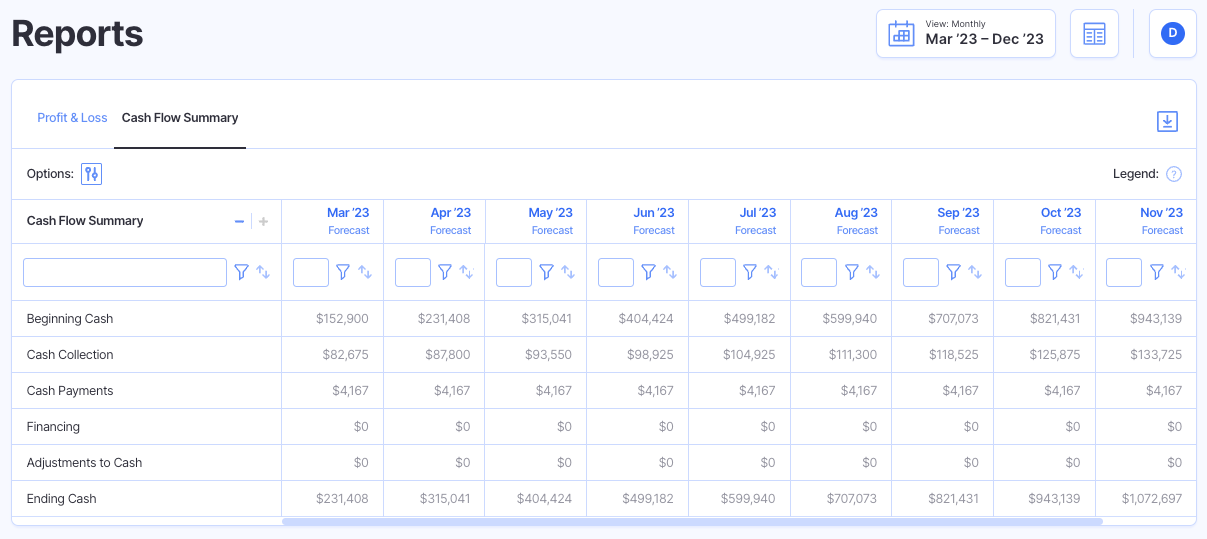
Cash flow projections show whether or not your company is generating cash, and how much. This will allow you to know how much cash you’ll have at any given point in time.
You can use that information to plan how to use a projected cash surplus, or anticipate when to be more conservative if you’re projecting a cash shortage.
Balance Sheet
Last but not least is your balance sheet. Your balance sheet summarizes your company’s:
- Assets: What your company owns.
- Liabilities: What your company owes.
- Shareholder equity: How much your shareholders have invested in the company.
In summary, if you’re doing financial planning in anticipation of fundraising or to take on a loan, investors or lenders will use your balance sheet to calculate your company’s projected net worth and financial efficiency.
A balance sheet projection is also handy to have for your own purposes, as well, particularly as you grow.
You might not have plans to sell or seek investments today, but having the information on-hand and updated will save you a lot of stress and aggravation if and when the time comes.
How to Create Financial Projections
You’re probably wondering how to fit all of this financial information into a single report or page?
Well, you don’t have to.
The best way to create financial projections is in a dashboard. In most cases, you’re preparing financial projections to share with someone (potential investors, lenders, your team). Giving them a huge spreadsheet of numbers or multiple PDFs for each financial report is less than ideal.
While sharing PDFs and spreadsheets might’ve been the “standard” before, better solutions exist—like Finmark.
Here’s how to create financial projections that you can easily analyze and share with others.
Step 1: Gather Your Data
First, you need to get all your revenue and expenses together.
If you’re building projections for a new business, this will involve some estimations and guesswork. That’s ok.
Just make sure there’s a basis for your estimates that you can validate.
For instance, you can estimate your payroll projections by looking at salary benchmarks from a database like Glassdoor.
If you have historical data, this process is as simple as exporting your past 12 or so months of revenue and expense data into a spreadsheet.
You can make the process even easier by using a tool like Finmark that integrates with your payroll and accounting software to sync your actuals for you.
Step 2: Make Assumptions For Growth
Next, think about what factors will contribute to your growth and potential setbacks. This will help you make assumptions for revenue growth and any changes in your expenses.
For instance, do you plan to launch a new product or service in the next 12 months? Maybe you’re revisiting your pricing strategy or testing new marketing channels.
These are all things that will have a direct impact on your financial projections so they need to be accounted for.
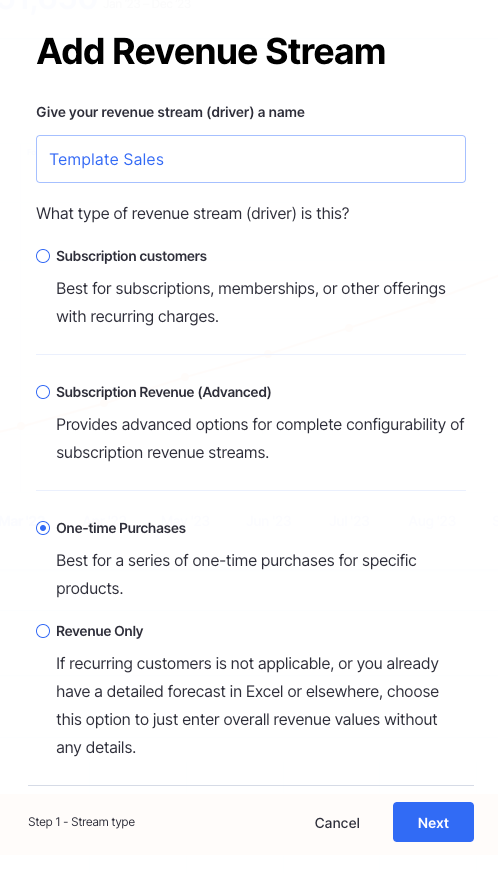
With Finmark, you can add these variables directly into your projections. For instance, new revenue sources can be added as revenue drivers.
All you have to do is fill out a few assumptions about the drivers and our software will calculate it into your revenue projections. The changes will also reflect in your financial statements as well.
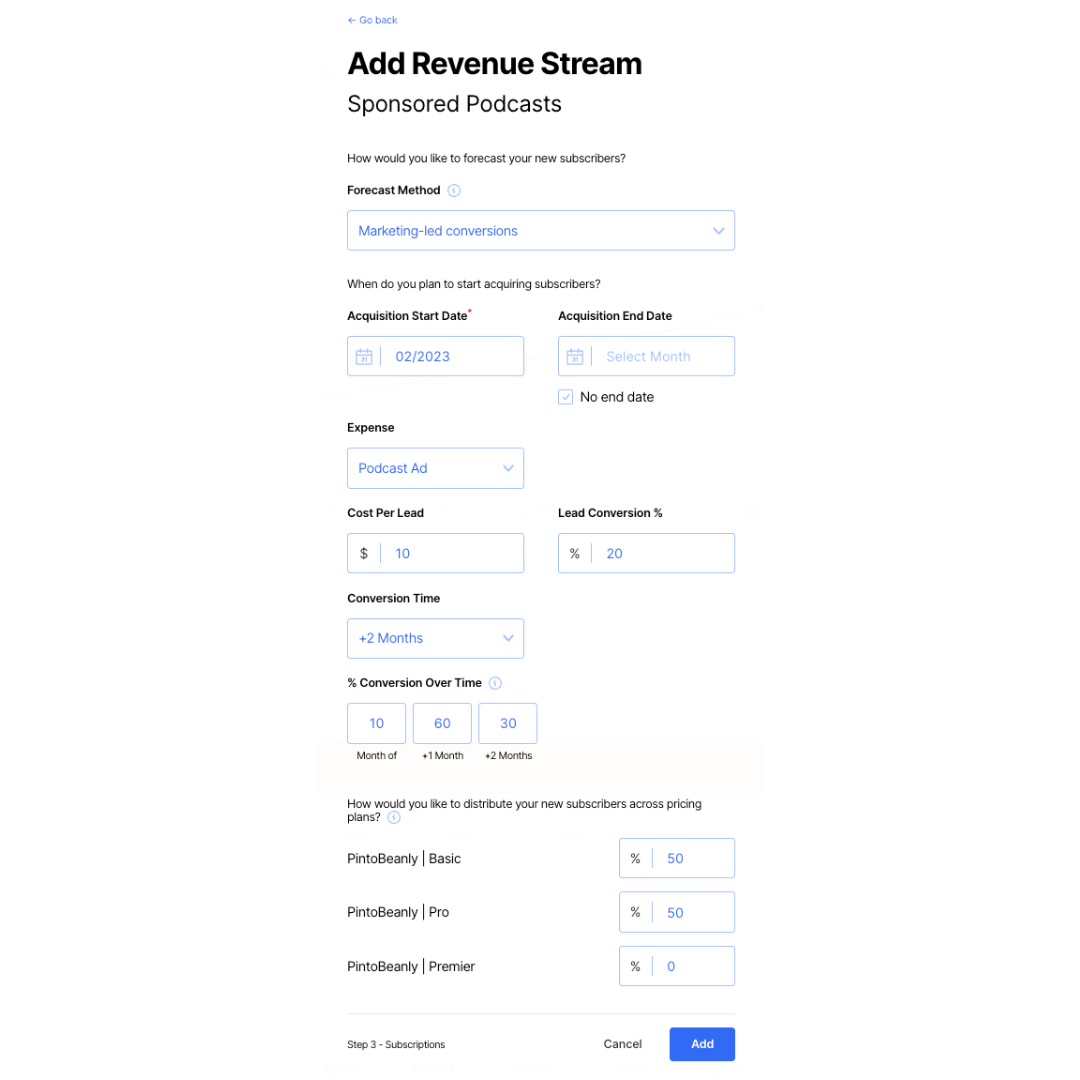
You can do the same thing with expenses.
For instance, if you plan to test a new marketing channel, you can build your assumptions directly into your projections.
If you’re using a spreadsheet to build your financial projections, this process will take a bit more elbow grease. That goes beyond the scope of this article however.
Plus, if you’re still using spreadsheets to manage your financial projections and forecasts, it’s probably time to upgrade to a dedicated financial planning tool like Finmark.
Step 3: Analyze The Results
Assuming you’re using Finmark, all your data will have been “crunched” automatically, allowing you to see your projected revenue, expenses, cash flow, and more.
Now, it’s time to analyze the results and draw conclusions.
Go through each area of your business and note down anything of interest. Here’s an example of the order you might review things in:
- P&L Statement
- Cash flow statement
- Balance sheet
- Revenue projection
- Expense projection
With this approach, you’re starting at a high level by reviewing projections for each financial statement. This is generally an easy way to spot potential red flags that need digging into.
For instance, maybe your P&L shows your net income shrinks considerably after six months. That would signal you to look at your detailed revenue and expense projections at months 4-6 to see what’s happening.
Or maybe you notice significant growth in your gross profit, and you want to revisit your expenses to see if the additional revenue can be used for new hires or other growth measures.
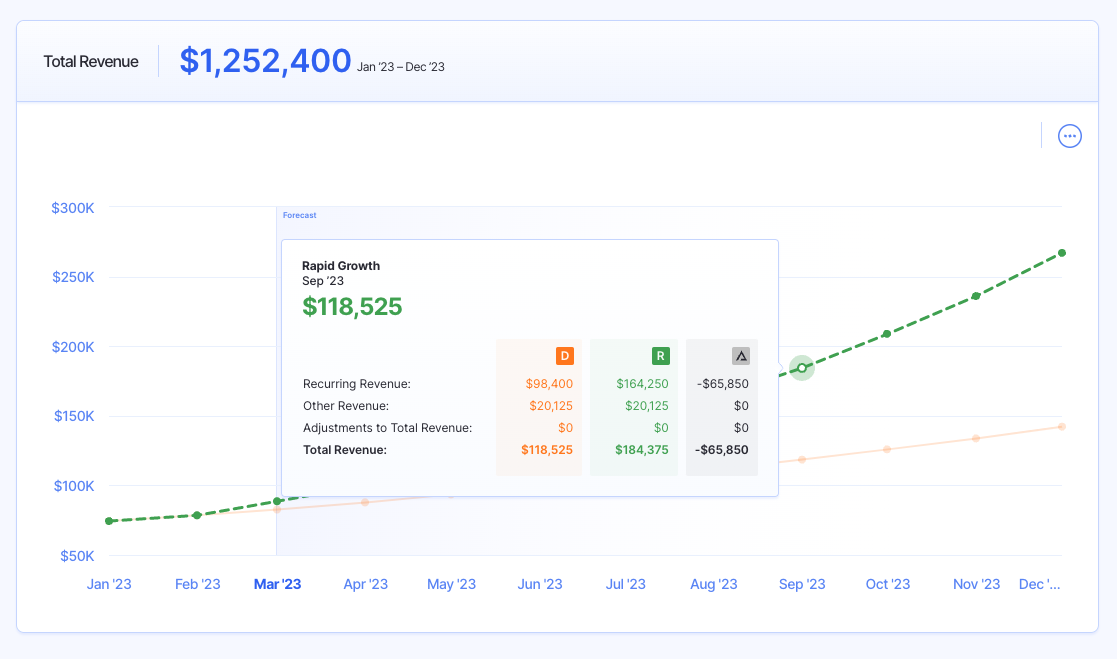
The beauty of Finmark is you can get these insights and immediately test your assumptions by adjusting your model. In our example, we might duplicate our current projection and make an alternative scenario with a few new hires.
Then, we can compare the two side-by-side and see how new hires will impact profit and our overall growth.
Step 4: Share Your Financial Projections
Once you’ve reviewed the projections and drawn your analysis, you can share it with potential investors, lenders, or stakeholders.
If you’re using spreadsheets, you may want to give view-only access or create a “Shared” version of the spreadsheet before sending it off.
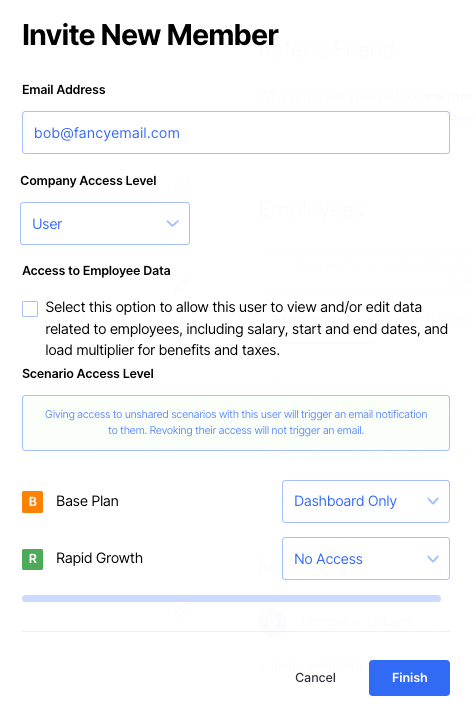
If you’re using a tool like Finmark, you can easily share access to your projections and customize their permission level.
Tips for Creating Financial Projections
On the surface, creating a financial projection for your business seems simple enough. It’s just a combination of different types of projections.
However, there are some mistakes you’ll want to avoid. There are also a few best practices to follow in order to get the most from all the financial planning you’re doing.
Don’t Expect Perfection
Financial projections aren’t meant to be 100% accurate.
There’s a long list of variables that can alter your projections.
For instance, if your sales team over or underperforms, it can change your sales projections.
Your conversion rates can also impact revenue.
Additionally, unexpected market conditions and the economy can play a role.
My point is, don’t obsess too much over trying to make your projections perfect because unless you have a magic crystal ball, perfect projections don’t exist.
Be Realistic
First and foremost, you need to be honest with your projections. When you’re pitching to investors, it’s tempting to paint the best picture of your company. However, if your numbers are overly optimistic, it can come back to bite you if you don’t deliver.
With that said, your projections should be based on data. The longer you’re in business, the more data you’ll have to build your projections. However, if you’re creating projections for a new company, things might not be as straightforward and there’s going to be more guesswork involved.
For those situations, it can be helpful to work backwards from your target goals in order to build your projections. In our revenue forecasting guide, we walk through an example of how to project revenue growth if you don’t have historical data. You can use that same process here as well.
The gist of the process, though, is to root your projections in reality. An easy way to do that is to figure out the “why” and “how” behind any assumptions you make for your projections.
For instance, if you project 40% revenue growth MoM for the first year of your business, you need a plan for how you’re going to achieve that.
Create Multiple Scenarios
If you’ve ready some of our content, you’ll know we’re all about scenario planning and analysis. Way too many founders make the mistake of creating one financial plan and running with it.
However, you also need to prepare for what happens if things go better or worse than expected.
Not only will this help you as a founder, but it’s also re-assuring for investors. Showing them that you’re prepared in case things don’t go as planned is a good sign that you’ll be financially-ready through the ups and downs.
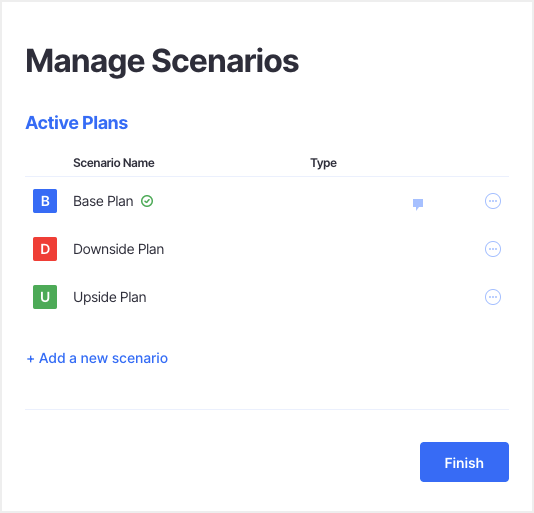
We recommend having three scenarios for your financial projections:
- Base plan: This is your working/operating plan that’ll likely be what you present to investors and stakeholders. It’s your base-level plan.Upside plan:This is your best case scenario that has assumptions of faster and larger growth.
- Downside plan: This is your “worst case scenario” that has assumptions of slower growth.
Don’t worry–you don’t need to manually create each scenario.
For example, if you use a tool like Finmark you can create and maintain multiple scenarios for your financial model and projections. Check out our scenario analysis guide to see how the process works.
Consider Doing a Rolling Forecast
A common question founders have is: “How far out should my financial projections go?”
There are two general approaches:
- Create an annual forecast: You create a model that projects the current year (i.e. January-December)
- Create a rolling forecast: You create a model that projects the next 12 months. So in March 2022, you’d see the projections through March 2023.
A rolling financial forecast can be beneficial for a few different reasons.
For one, it gives you a more dynamic view of your business. Instead of creating projections once and just sticking to it, you can update your projections in real time and see where you stand in the coming months.
On top of that, a rolling forecast is more forward looking. In October, you want to see what you’re projected to do through the beginning of the next year, not just over the last few months of the current year.
Keep in mind, a rolling forecast is easiest if you’re using a tool that takes care of the legwork for you rather than having to manually copy/paste data and formulas every month.
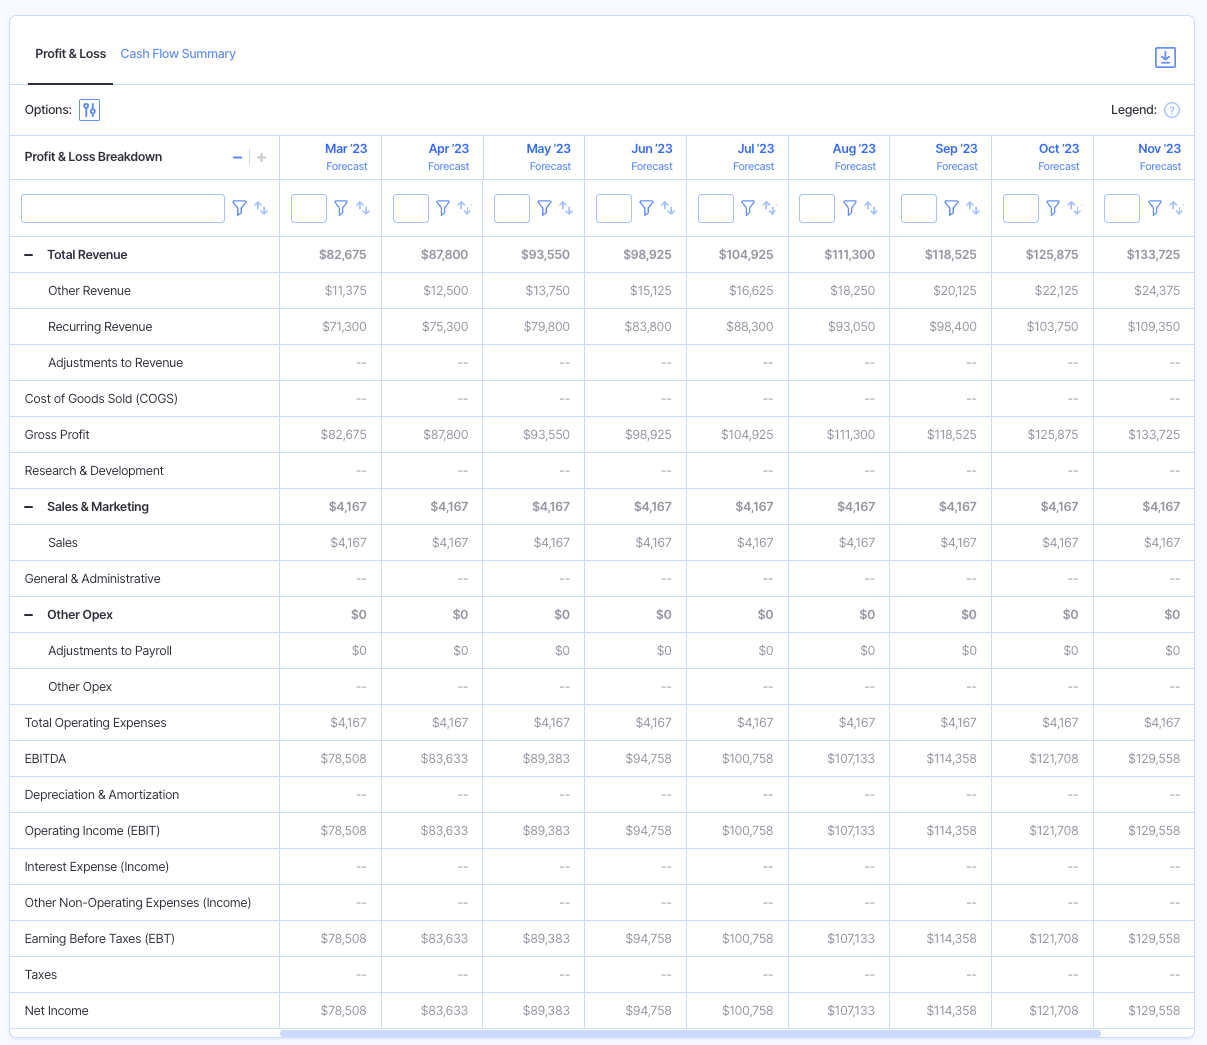
Create a rolling forecast in Finmark!
Check (And Update) Your Projections Regularly
Staying on the theme of making your projections dynamic, be intentional about checking and updating your projections.
It requires a bit of a mindset shift, but when you stop looking at your financial projection as just a collection of documents and more of a tool to plan growth, it becomes much more useful.
For instance, if your original projections forecast that you’ll reach $500K in MRR within the next few months, but you’ve noticed your lead volume has been declining, use that as an opportunity to dig into why you’re generating fewer leads.
From that point, you can decide what you need to do to get back on track and you may have to update your financial plan based on a lower lead volume.
Your financial projections can help you gauge whether your business is growing fast enough, as well as help you predict issues before it’s too late.
Have You Made Your Financial Projections?
Financial projections paint a picture of your company’s financial performance today and in the future.
In short, whether you’re a bootstrapped startup, seed-stage company seeking funding, or a growth company that’s well funded, taking the time to create financial projections will give you a huge advantage as you build and grow your business.
This content is presented “as is,” and is not intended to provide tax, legal or financial advice. Please consult your advisor with any questions.
