Financial Dashboard: 24 Metrics Every Finance Team Should Include
Financial dashboards save you time spent digging for information. When used properly, they are the perfect way to stay on top of your business’s overall performance and financial health.
Building out a financial dashboard takes time as you work out what metrics to include and how to present it. But with this guide, you’ll have a head start.
What Is a Financial Dashboard?
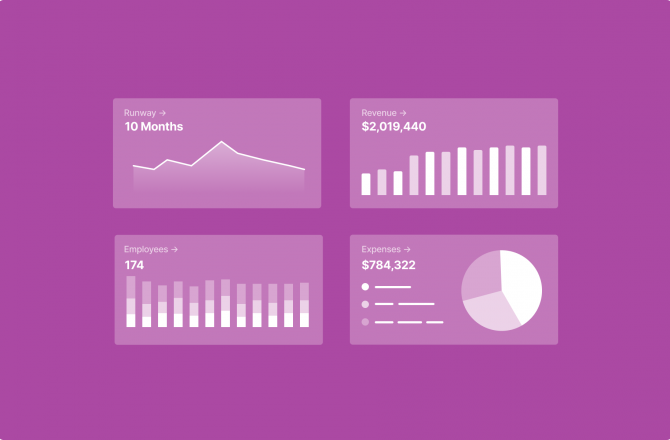
Financial dashboards are a collection of metrics and graphs that are used to understand the business at a glance. They expand on basic financial reporting by pairing it with other business metrics.
A good financial dashboard has many benefits:
- Easy tracking of key performance indicators (KPIs)
- Saving time digging through multiple reports for important information
- Snappy, data informed decision making
What’s included in a financial dashboard ultimately depends on who’s using it. That’s why we’ve provided 24 metrics grouped by who would use it and how they’d benefit.

Basic Financial Performance Dashboard
A basic financial performance dashboard helps keep tabs on general financial health and gives you the ability to drill down into specific areas. It tells you the money the business makes, the money spent, and how much of it is left over.
What To Include
- Gross profit: The amount of money earned on sales after all direct costs are accounted for (Net Sales – Cost of Goods Sold)
- Gross profit margin: The percentage of money left over from product sales after all direct costs are accounted for (Net Sales – Cost of Goods Sold) / Net Sales)
- Net operating income: The amount of money left over after all direct and operational costs are accounted for (Operating Revenue – Total Expenses)
- Operating margin: The efficiency at which revenue becomes operating income (Operating Income / Total Revenue)
- Accounts receivable aging: A report that buckets all unpaid invoices by customer and time since being issued
- Accounts payable aging: A report that buckets all unpaid invoices the business owes and the time since being issued
Who Will Use It and How
The metrics you include in a basic financial dashboard should provide insight on both the short and long-term. Anyone can use it to get an idea of how much revenue is being generated and how efficiently it becomes profit.
Gross profit and gross profit margin shed light on how much money is generated through sales after direct costs. Both are key metrics for stakeholders to understand the scalability of the business—the higher the gross profit and margin, the more money gets pocketed on a sale to cover operating costs.
The net operating income and operating margin expand on gross profit metrics by showing how efficiently the business turns that revenue into net profit. Having a high gross profit margin and a low operating margin shows the business is scalable, but may need financing to cover costs while it expands.
The final piece of the picture is any outstanding revenue and costs. Users can review accounts receivable aging and accounts payable aging reports to understand the short-term impacts on cash flow.
Pro tip: visualize gross profit and net operating income with a 2 way bar graph to see the revenue and expenses behind the net dollar value. Gross profit margin and operating margin depicted with a line graph shows if your efficiency is increasing over time.
Executive Overview Dashboard
You don’t have to be an executive to benefit from an executive overview. This dashboard focuses on the long-term sustainability of the business with key information for potential investors.
What To Include
- Working capital: How much money the business would have after paying off all debts (Total Assets – Total Liabilities)
- Current ratio: The ratio of assets to liabilities, another way of understanding whether a business can pay off all its debts (Total Assets / Total Liabilities)
- Net burn: The net cash flow from operations—it’s only referred to as net burn if it’s negative
- Cash runway: The amount of time until working capital is forecasted to hit $0 based on the net burn
- Debt-to-equity ratio: A ratio showing how much of the business is funded by debt versus investment (Total Debt / Total Shareholder Equity)
- Operating cash flow ratio: A measurement of how effectively a business can pay off its debt from cash flow (Cash From Operations / Current Liabilities)
Who Will Use It and How
The executive overview is especially helpful for early stage businesses and startups to visualize how close they are to profitability and whether they can (and should) pursue more debt or investment.
Using working capital and cash runway, users see how much the business has to work with and how much time they have operating under the status quo.
The dashboard leads to quick decision making around reducing costs (net burn) and whether more debt is sustainable (current ratio and debt-to-equity ratio). If the business has enough cash flow to cover debts (operating cash flow ratio), an additional loan or line of credit is possible.
Pro tip: Map out the current ratio and debt-to-equity ratio with a line graph. They show if the business is becoming more efficient at turning debt into assets or retained earnings. If the ratios are trending up, long-term debt has a higher likelihood of becoming an asset down the line.
Forecasting and Variance Dashboard
Every business wishes they had a soothsayer to see their future. The next best thing? A forecasting and variance dashboard that projects the future and explains any variance.
What To Include
- Forecasted vs actual revenue: The predicted revenue for a period versus the actual results
- Budget vs actual spend by expense type: The predicted expense levels for a period versus the actual results broken up by expense type
- Total headcount by department: The amount of employees in the organization broken up by the department they work in
- Cash balance vs goal: Total cash assets versus a projected or desired cash balance
Who Will Use It and How
The forecasting and variance dashboard answers two questions:
- Where is the business heading?
- Why did it make or miss that forecast
The two key components are forecasted vs actual revenue and budget vs actual spend. These two reports are an essential breakdown of what differed between the forecast and the actual.
Total headcount by department helps businesses determine whether the workforce is sufficient for the forecasted activity. This lets you make employment decisions quickly while backed by data.
Using cash balance vs goal helps you understand the impact of the variance on the timeline to reach your goals. That next big purchase might be closer or further than you think.
Pro tip: A bar graph with marker lines for budgets and forecasts is the perfect way to see how much you over or underestimated activity to be. Additionally, you get a clear visual of how your forecasts and budgets change over time.
Marketing Financial Dashboard
One department that needs to act quickly with data informed decisions is marketing.
With clear information on the return on their spend, they become the key component of generating consistent revenue.
What To Include
- Customer lifetime value (LTV): How much the average customer purchases in their lifetime (Total Revenue / Number of Customers)
- Cost of acquisition (CAC): The average amount of marketing spend necessary to generate one customer (Total Marketing Spend / Number of Customers)
- LTV vs CAC ratio: A ratio of how much a customer spends in their lifetime versus how much is spent to acquire them (Lifetime Value / Cost of Acquisition)
- Sales growth rate: How much sales are increasing from one period to the next (Current Net Sales – Prior Period Net Sales / Prior Period Net Sales)
Who Will Use It and How
Marketing teams need clear information on how much a customer is worth and how much it costs to acquire one. This helps them decide which marketing channels generate revenue sustainably or costs more than it’s worth.
Customer lifetime value (LTV) is an essential stat for businesses of all types. Whether you’re an ecommerce company or a service provider, knowing the value of a customer is an important metric to determine what your marketing strategy should be.
Pair the LTV with the cost of acquisition (CAC) and you get a quick snapshot of whether your marketing efforts are generating or losing money. An LTV vs CAC ratio greater than 1 makes more money than it spends. But once it drops below 1, it’s no longer a cost-efficient marketing strategy and you may need to do some optimization (or use that money elsewhere)
Sales growth rate helps visualize how effectively the business is growing. When trying out different marketing strategies, this metric helps you understand how much of an impact it has versus the prior period.
Pro tip: Using gross profit margin or operating margin on a customer’s LTV gives you an estimate of how much of that value turns into gross or net profit. This extra step gives an even clearer picture of what is a sustainable and scalable CAC.
Cash Flow Analysis Dashboard
No metrics are a better picture of how money moves through a business than cash flow metrics and reports. Using a cash flow analysis dashboard lets you know whether you have the cash on hand to carry you into the future.
What To Include
- Cash balance: The total amount of accessible cash in assets like bank accounts and cash on hand
- Cash inflows and outflows: How much cash is entering or leaving your business including financing like credit cards or loans
- Runway: How long the current cash level could carry you given the current cash outflow
- Net burn trends: How your net burn changes over time
Who Will Use It and How
Every finance department (FP&A, AR/AP, accounting, etc.) should be kept in the loop on cash flow. Armed with this information, they can create a plan to have sufficient cash on hand to get ahead of any money stress.
Cash balance and cash runway are the “at a glance” metrics. By tracking how much cash is available and how long it will last, businesses can adjust their budgets to speed up or slow down spending.
Cash inflows and outflows are the in depth breakdown of why the cash runway is what it is. This can be presented in a cash flow statement broken up by operating, investing, and financing activities. Some businesses use a customized breakdown based on their needs.
Net burn trends help visualize whether the business has become more or less efficient with its spending. When broken up by specific vendors and time periods paired with some conditional formatting highlighting above and below average periods, you’ll see where you’re tightening up or increasing activity.
Pro tip: Use a two-way bar graph with cash in going up and cash out going down. The net result can be drawn as a line through the graph to help visualize your cash trends.
Start Building Dashboards Today
Financial dashboards and models are powerful tools for your business. When you’re using the right software, making dashboards for any situation becomes a breeze.
With Finmark from BILL, you can create a customized one-stop-shop of essential metrics and KPIs or hit the ground running with pre-built reports. You can easily create multiple dashboards to track the complete financial health of your business, and use integrations to update your actuals.
Get started with a free 30-day trial.
Contributor
This content is presented “as is,” and is not intended to provide tax, legal or financial advice. Please consult your advisor with any questions.