Rolling Forecasts: Definition & How to Create One
If you created a budget in December of last year, by April of the next year that budget probably doesn’t hold a lot of weight.
Business isn’t static and conditions change rapidly. If your forecast isn’t flexible or was created with data from 12 months ago, chances are it’ll be become increasingly outdated and unreliable as the year goes on.
And what’s the point of making a forecast if you’re not going to use it?
That’s where rolling forecasts come in.
In this article, we’ll go over what a rolling forecast is, why it’s better than old-school annual budgeting, and the steps you can take to make the switch.
What is a Rolling Forecast?
A rolling forecast is a report that projects your budget, revenue, and expenses on a continuous basis. It takes into account YTD performance, your original budget, current market conditions, and other factors to project future performance.
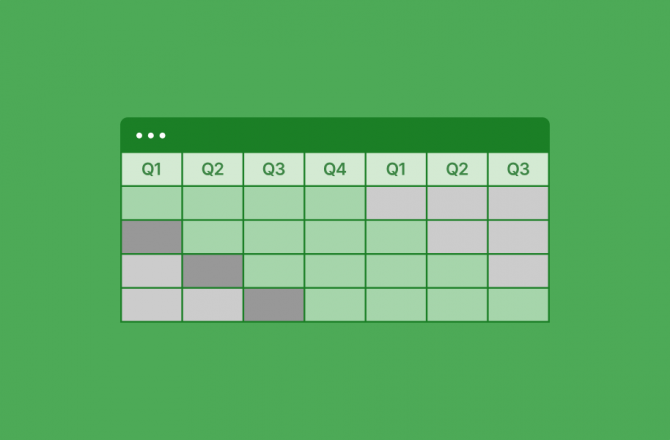
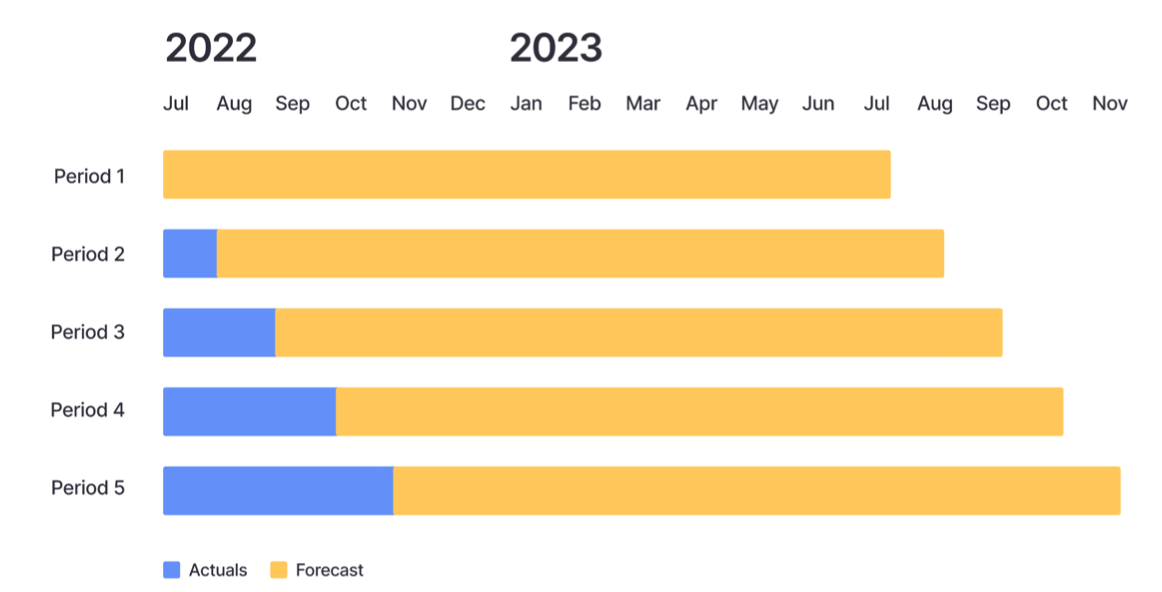
Unlike a traditional annual budgeting approach, a rolling forecast is typically updated monthly or quarterly, and has a forecast period 12-24 months out. Meaning in June 2023 you’d see a rolling forecast of July 2023-June 2024. In July 2023, the forecast will update to include the actuals from June 2023 and so on.
Here’s a visual representation.
Rolling Forecasts vs. Static Budgeting
The issue with static budgets is they don’t account for real-world changes. Creating a budget once and relying on that plan for the rest of the year puts you in a box.
As you experience fluctuations in revenue, expenses, or market conditions, your forecast needs to adjust as well.
Another key difference between rolling forecasts and static budgets is the period of historical data they use. Static budgets often rely on the previous year’s performance to forecast the numbers for next year. The issue with that is June of this year may be drastically different than June of last year.
Rolling forecasts take last year’s performance into consideration, but it’s balanced with more recent data (the past few months), which gives you the best of both worlds.
The Benefits of a Rolling Forecast
If you’re on the fence about whether or not it’s worth switching from a static budget to the more flexible rolling forecast approach, don’t be.
Whether you’re a founder or work within a finance team, rolling forecasts will save you time and give you more accurate data for decision-making. Here’s why you should give rolling forecasts a try:
Rolling Forecasts Take Everything Into Account
Traditional budgeting is primarily quantitative. It looks at your past performance and uses those numbers to project how much you’ll spend in the future. Rolling forecasting takes your past performance into account, but also uses qualitative data.
Changes in your industry, new regulations, and consumer trends are all factors that can impact your future revenue. If you account for this type of qualitative information in your forecast, you can save yourself from overspending before it’s too late.
Changes in your industry, new regulations, and consumer trends are all factors that can impact your future revenue. Click To TweetRolling Forecasts Give You More Realistic Projections
You know the saying, “past performance is no guarantee of future results”? It really rings true when it comes to financial forecasting.
Relying on last year’s performance to forecast what you’ll do this year is like assuming your favorite sports team is going to have the same results this season as they did in the previous one.
Imagine a hotel making business decisions for 2020 solely based on its budget and performance from 2019. It would result in a lot of bad decisions since 2019 had “normal” circumstances and 2020 ended up being the worst year ever for the hotel industry.
With a rolling forecast, by the time March came around the hotel could update their projections based on the current business conditions. They could account for lower occupancy rates and less revenue, which they could then build into their budget.
Rolling Forecasts Make Investor Meetings Easier
Whether you’re reporting your performance to investors or fundraising, a rolling forecast makes presenting your numbers easier.
For investor updates, you’ll be able to explain the “why” behind all your metrics since you’re reviewing and updating them on a more regular basis.
If an investor has a question about why you’re forecasting an increase over the next few months or why you underperformed your previous projections, you’ll be able to give concrete answers instead of guesses and speculation.
If you’re fundraising, rolling forecasts keep your data clean and consistent, particularly for follow-on rounds. When you only update your financial model every six or twelve months, it’s easy to forget why certain metrics are what they are and why each model is so different. A rolling forecast eliminates that since it’s regularly updated.
Rolling Forecasts Can Be Used as a Growth Tool
One of the biggest issues with the traditional approach to forecasting is that it’s often done as a task.
What I mean is you create a budget at the end of the year for next year, then it just sits in an Excel file that you don’t open for months. Since it doesn’t get updated, it becomes more inaccurate every month. Eventually, it’ll get to the point where your actuals are so far off from your budget that you don’t even feel a need to check it anymore.
Since rolling forecasts are dynamic, it gives you a compelling reason to regularly review your numbers and compare your budget to your actuals. When there’s a discrepancy between what you forecasted and your actual performance, you can analyze what happened since your data is more up-to-date and reliable.
Your business changes every month, so why should you only update your forecast every 12 months? Click To TweetRolling Forecasts Make Scenario Planning Easier
Speaking of using your forecast as a growth tool, one of the best ways to use a forecast is for scenario planning.
Scenario planning is when you create multiple scenarios based on different assumptions. In most cases, you’ll have at least three scenarios:
- Base scenario: This scenario assumes standard performance, based on your budgeted numbers.
- Upside scenario: This scenario assumes you’ll perform better than your base scenario.
- Downside scenario: This scenario assumes you’ll perform worse than your base scenario.
👉 Learn more about scenario planning and analysis here.
Your assumptions are at the center of scenario planning. The more realistic your assumptions, the more accurate your forecasts will be.
Traditional forecasting is based on the previous year’s performance. However, what was considered underperforming or overperforming last year might not be the same this year.
For instance, if last year was exceptionally good, a churn rate of 5% might be considered bad for you. As a result, your downside scenario might assume a 5% churn rate. But this year, if business conditions change and 5% becomes your average churn rate, the downside scenario you created at the beginning of the year is obsolete.
On the flip side, a rolling forecast takes into account recent revenue, churn, expenses, and other metrics. Based on those numbers, you can more accurately project what overperforming or underperforming looks like and update your scenarios accordingly.
Why Doesn’t Everyone Use Rolling Forecasts?
I can see you scratching your head right now. You’re thinking, “if rolling forecasts are so much better, why doesn’t everyone use them?”
Two of the main reasons founders and finance leaders use other budgeting and forecasting methods are:
Change is Difficult
As humans, we’re creatures of habit. When you’ve been using a specific forecast process for years, you get into a routine that you’re comfortable with and feel like there’s no reason to change. As the saying goes, “if it ain’t broke, don’t fix it.”
On top of that, making any changes to your financial planning approach means you’re changing systems and processes which takes time. However, the initial time you spend to set up your rolling forecast will be well worth it long term.
It Requires More “Maintenance”
This is probably one of the biggest misconceptions about rolling forecasts. Since they’re updated monthly or quarterly, the assumption is that you’ll need to spend hours on data entry.
That might be true if you’re spreadsheets. However, if you’re using a tool like Finmark from BILL, creating a rolling forecast is very simple and most of the work is done for you.
I’m not going to give you a whole sales pitch, but if you’re looking for a tool to make financial planning and forecasting easier, click here.
How to Create a Rolling Forecast
Here’s how to create a rolling forecast for your business:
1. Get Everyone Onboard
First and foremost, make sure you have buy-in from all stakeholders and contributors. We’re firm believers that financial planning shouldn’t be done in isolation.
At minimum, your forecast should have input from the founders, department heads, and your finance team. It’s important that everyone understands how your forecasting process works, particularly if you’re switching from a static approach to something more dynamic like a rolling forecast.
If your heads of marketing, customer success, and sales are used to creating their budget at the beginning of the year, you’ll have to make it clear that the budget will be updated on an ongoing basis from now on.
If everyone isn’t aligned, updating your forecast is going to be like pulling teeth.
Remember, rolling forecasts use qualitative and quantitative data. While you might be able to track down your marketing, sales, and retention metrics, your department heads will be the ones that give you more of the qualitative information that’ll help you make better assumptions.
For instance, if your lead conversion rate jumped 50% one month, your head of marketing will be able to tell you why and whether or not it’s repeatable. It could be that they allocated more money towards a higher converting channel or a one-time webinar landed very high quality leads. That information needs to be accounted for in your forecast.
2. Decide What Metrics to Forecast
Once you have everyone on the same page, it’s time to decide what you want to include in your forecast. You might already have a list of metrics you track and forecast, but in case you need a starting point, here are some that we recommend:
- Runway
- Burn rate
- Revenue
- Churn
- Total expenses
- Average revenue per account (ARPU)
- Gross margin
- Customer LTV
- Customer acquisition cost (CAC)
- CAC payback
You can track and forecast all of these metrics and more in Finmark by the way.
3. Set a Time Horizon
Next, you need to decide what period of time you want to forecast. Do you want to forecast the next 6, 12, 18, or 24 months. Longer forecast periods can be helpful directionally, but don’t expect them to be accurate. Shorter forecast periods might be more accurate but they may not be forward-looking enough depending on your business model.
A good time frame to start with is 12 months. That’s far enough into the future to see trends, but short enough to be able to make actionable decisions.
You also need to decide how often you want to update your forecast. The frequency will largely depend on your industry and business model. Let’s compare insurance companies to SaaS companies for instance.
Insurance companies generally don’t see big spikes and drops in revenue because people don’t cancel or switch insurance very frequently. As a result, they might be able to update their financial forecasts quarterly.
SaaS companies on the other hand can fluctuate significantly based on a variety of factors. An acquisition channel can take off, an outage could cause a jump in churn, or a new competitor can take market share. Therefore, it makes sense for them to update their forecast more regularly.
4. Create Multiple Scenarios
With your time period set, you can set up your different scenarios. Again, we suggest having three scenarios in your forecast:
- Base scenario
- Upside scenario
- Downside scenario
At this stage, you’re going to make your assumptions for each scenario. That goes beyond the scope of this article, but we have an entire article to walk you through the process!
5. Analyze & Adjust
Your forecast isn’t meant to be a static document that sits and collects dust. You should regularly check it and measure your actuals against what you forecasted.
This is one of the biggest benefits of a rolling forecast. It gives you a sense of accountability because you need to challenge yourself to understand the “why” behind your numbers.
Did you perform better, worse, or on target?
If you performed better than your forecast, try to figure out why, and whether or not it’s something that you can repeat and scale. Did a marketing campaign work better than expected? Did your sales team beat their quota? Did you spend less than expected on certain expenses?
Do the same thing if you performed worse than your forecast.
It’s not enough to know what your numbers are, you also need to understand the “why” behind them. A rolling forecast makes that process easier.
Ready to Roll?
We’re not saying that traditional annual budgets are dead (ok, maybe we are), but the benefits of rolling forecasts are too good to ignore.
If you made it all the way to the end of this article and you’re ready to give rolling forecasts a try, sign up for a free trial of Finmark today. It’s faster than building forecasts and financial models in spreadsheets and easy to get started.
This content is presented “as is,” and is not intended to provide tax, legal or financial advice. Please consult your advisor with any questions.